junk studies: university of florida post covid risk
a tour of post facto assumptive fallacy and masking undisclosed models as data
cliff notes:
this study from the university of florida is pure GIGO
it’s a post facto study with massive risk variance in cohorts by age, diabetes, hypertension, and COPD prevalence
the “adjustments” for this are just a model and are not disclosed
they clearly fail to account, in total, for even one of the risk factors
they fail to align with their own control group
this study is meaningless and should be ignored. it’s datacrime, not data.
analysis:
there have been a lot of junk studies around covid that rely upon lacking valid control groups and assumptive fallacy.
but wow, this one is a doozy. it’s clearly designed to scare people, but it does so by presenting the data in a manner so misleading as to be meaningless.
the key claim is that those who get severe covid are more likely to be hospitalized again when compared to those who had a mild or moderate case.
but does this study actually prove or even mean anything?
it appears not.
first off, the entire study design is hopelessly broken and the cohorts dramatically misaligned. further, we’re dealing with a very small active N. claims of 10,646 are misleading. there were only 325 that had covid: 114 severe, 211 mild or moderate. so this is a tiny study in terms of the active arms and took place looking at records that were only 3% covid positive. but that is the least of its issues.
the essentially insurmountable problem is that these groups look nothing like one another demographically and the severe cases are so much higher risk than other cohorts as to unfixably queer the comparison.
this is post facto, not pre-randomized and balanced. that means that no matter what you do, the data quality is going to be low and could easily be complete gibberish.
at best, you’re at the mercy of the accuracy of a risk leveling model.
let’s look:
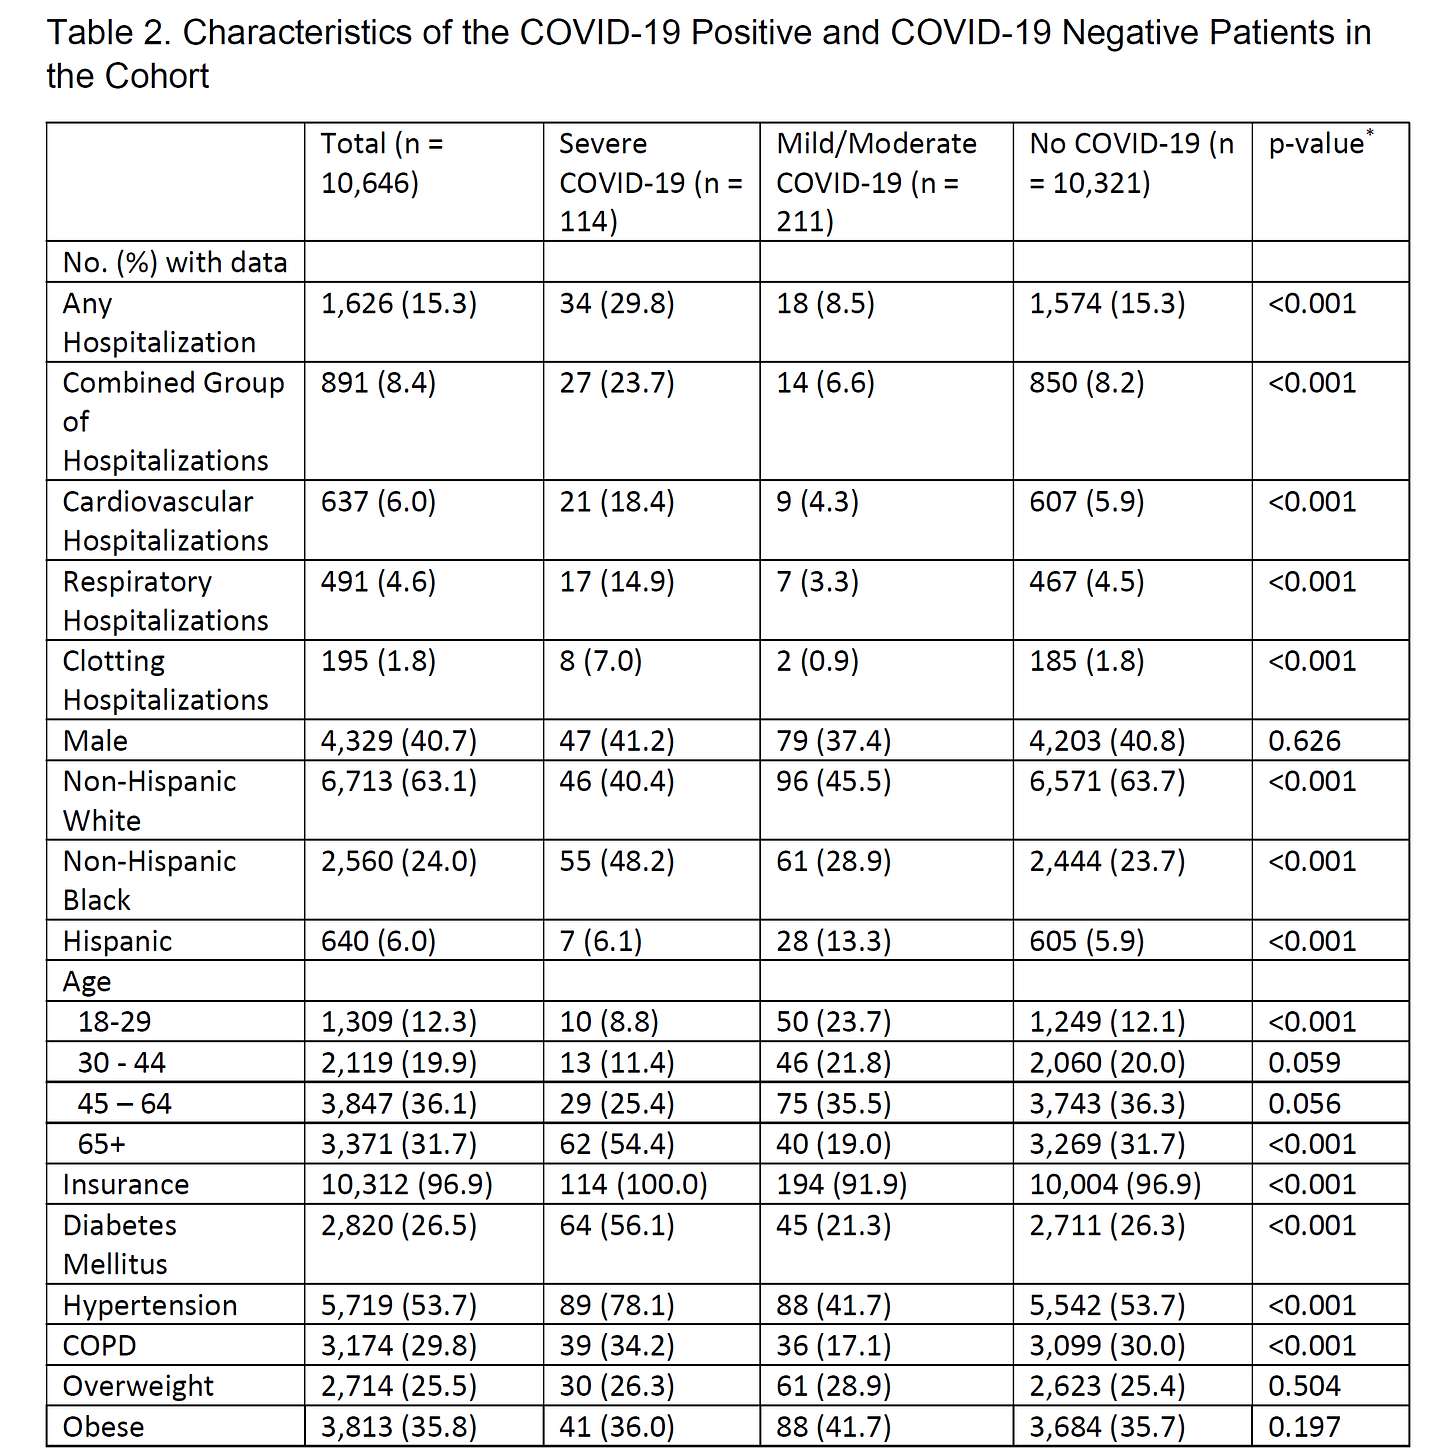
note the massive divergences:
54% over age 65 vs 19% in mild and 31% in non covid.
56% diabetes vs 21% mild, 26% non covid
78% hypertensive vs 41%, 53%
34% chronic obstructive pulmonary disease (COPD) vs 17% in mild 30% non-cov
also racially mismatched with severe as 48% black vs 29%, 24%
every one of these aggressively favors severe disease cohort baseline risk vs mild.
in fact, this is almost certainly WHY they got severe disease instead of mild. it is a veritable laundry list of covid enhancing comorbidities and taken in conjunction blow relative risk rate into the stratosphere. they are also comorbidities associated with 20 other kinds of hospitalization.
from this we get raw data on hospitalization post covid.
several interesting things emerge here. first off, comparing severe to mild covid is a fraught as mild covid actually had an 8.5% hospitalization rate vs 15.3% in non covid so, somehow, mild covid led to FAR less future hospitalization than never having had any. given how much younger and healthier the “mild covid” group was than “no covid” this is not surprising. it’s showing the risk divergence that makes this study so poorly structured.
severe covid cohort had 1.95X the risk of non covid and 3.5X the risk of mild covid for re-hospitalization.
it’s a scary sounding variance, but given the enormous differences in risk levels and how intensely that stratifies risk of covid, covid severity, and overall hospitalization it could easily be meaningless.
one wonders why the authors did not, for example, look at the base hospitalization rates of the patients in the 6 months prior to study start date and use a self baseline figure that could then be compared to increase in hospitalization typically experienced post other diseases.
when you are old and sick, any disease from flu to bacterial infection can weaken you and leave you open to later infection. it also selects for lower immune function and thus higher risk of everything. the easiest way to control (somewhat) for that is to use patients as their own baselines.
instead, the authors used a technique known as “making up a bunch of stuff and pretending that our assumptions are data.”
they “adjusted” the data for risk. how is anyone’s guess as they do not share the methodology or the weightings in the paper.
but this means that this is now a model, not a study.
it is only as good as this risk adjustment and that is never going to be that good, especially in a data-series this small. and these numbers are fishy.
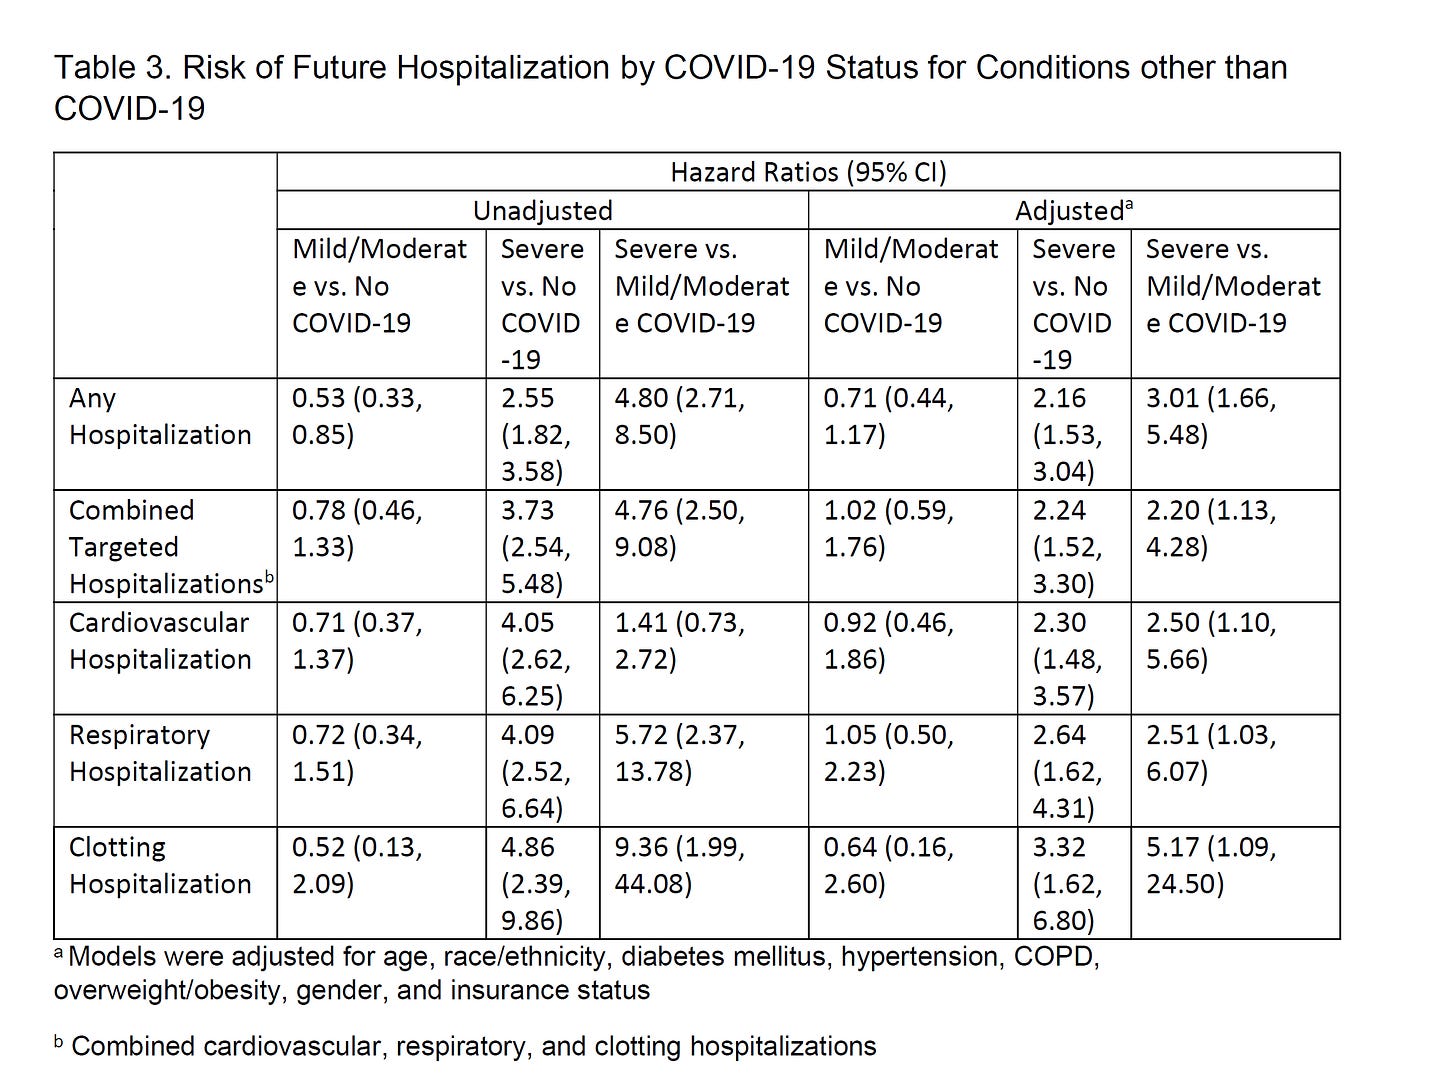
the unadjusted risk ratios look off to me. 4.8 severe vs mild and 2.55 vs no covid.
where is this number coming from?
29.8% of severe were re-hospitalized. 8.5% of mild. 29.8/8.5 = 3.5, not 4.8
15.3% of no-covid were hospitalized. 29.8/15.3 = 1.95, not 2.55
so either they are parameterizing hospitalizations somehow and adding a layer of modeling before running it through the second model (and error bars multiply) or there is some math or attribution issue here.
the paper is not forthcoming on how they made this jump.
they then “adjust” the data using some sort of black box.
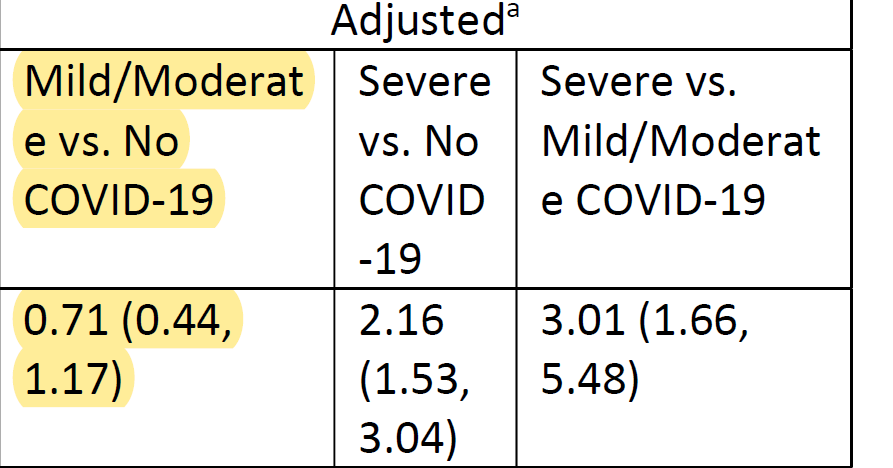
4.8 risk ratio for severe/mild drops to 3.01
2.55 risk ratio for severe/no covid drops to 2.16.
so, this “adjustment” implies:
the severe cohort had 59% higher risk than that mild at baseline.
the no covid cohort had 18% higher risk.
this is, frankly, ridiculous given the variances above. 54% over 65 vs 19% in mild in multiplicative conjunction with over twice the rate of COPD, diabetes, and hypertension is going to drive FAR more risk than has been adjusted.
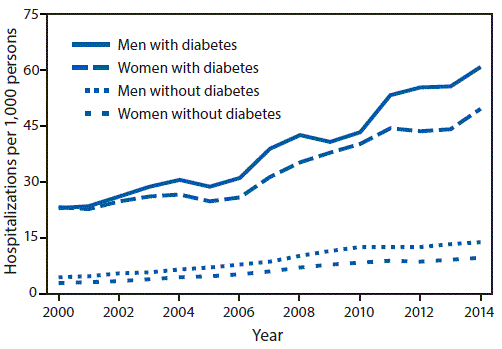
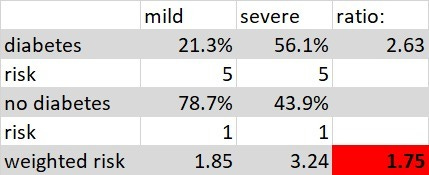
diabetes alone adds 5X risk of baseline hospitalization.
we can then cohort adjust this to express the effect of this added risk on the full group:
so, diabetes alone would add 1.75 to severe vs mild as a risk weighting. this already exceeds the full 1.54 adjustment that was applied and we have not even looked at age, hypertension, and COPD yet and that last one is a biggee.
these risk factors also interact in multiplicative fashion. being old and diabetic and hypertensive and having COPD means you’re going to be seeing a lot of the inside of hospitals.
the author’s adjustment looks woefully inadequate and we can check our work by looking at this:
if this adjustment were really on point, you’d expect to see mild/moderate align with control. instead, it shows up as MUCH lower risk than control. so either getting covid makes you healthier to the point of wiping out nearly 1/3 of impending hospitalization of this adjustment failed substantially to level cohorts.
one might be temped to ascribe this to “inoculation” preventing future covid hospitalizations, but this does not appear plausible. infection rates in this study were ~3% and hospitalization rates would be <5% of that. hard to see how that would even move this ratio a point or 2 over a 6 month period.
the study authors make claims like “hospitalized with post covid complications” but this is nowhere substantiated.
this whole study is badly assumptive claims wrapped around a model to “adjust” data coming from post facto cohorts that are so polyglot as to be irreconcilable.
this failure of adjustment can be demonstrated without even seeing whatever black box the authors used to do it. the magnitudes are obviously way out of line and the “control” group fails to balance with mild post adjustment.
it’s just an exercise in GIGO and an object lesson in using hidden assumption and models dressed up in “mathiness” to look like science.
this proves nothing whatsoever save for the credulity of media and lack of rigor of the authors lab.
this paper should be ignored.



"one might be temped to ascribe this to “inoculation” preventing future covid hospitalizations, but this does not appear plausible."
Nah. I can practically guarantee that the fearmongers trying to defend this study would be in no hurry to admit the existence of natural immunity.
It's so disheartening to see the very scientists whom we should be able to trust use information as a weapon. Thanks for being on the lookout for the scammy information and for taking the time to inform us. It is greatly appreciated.