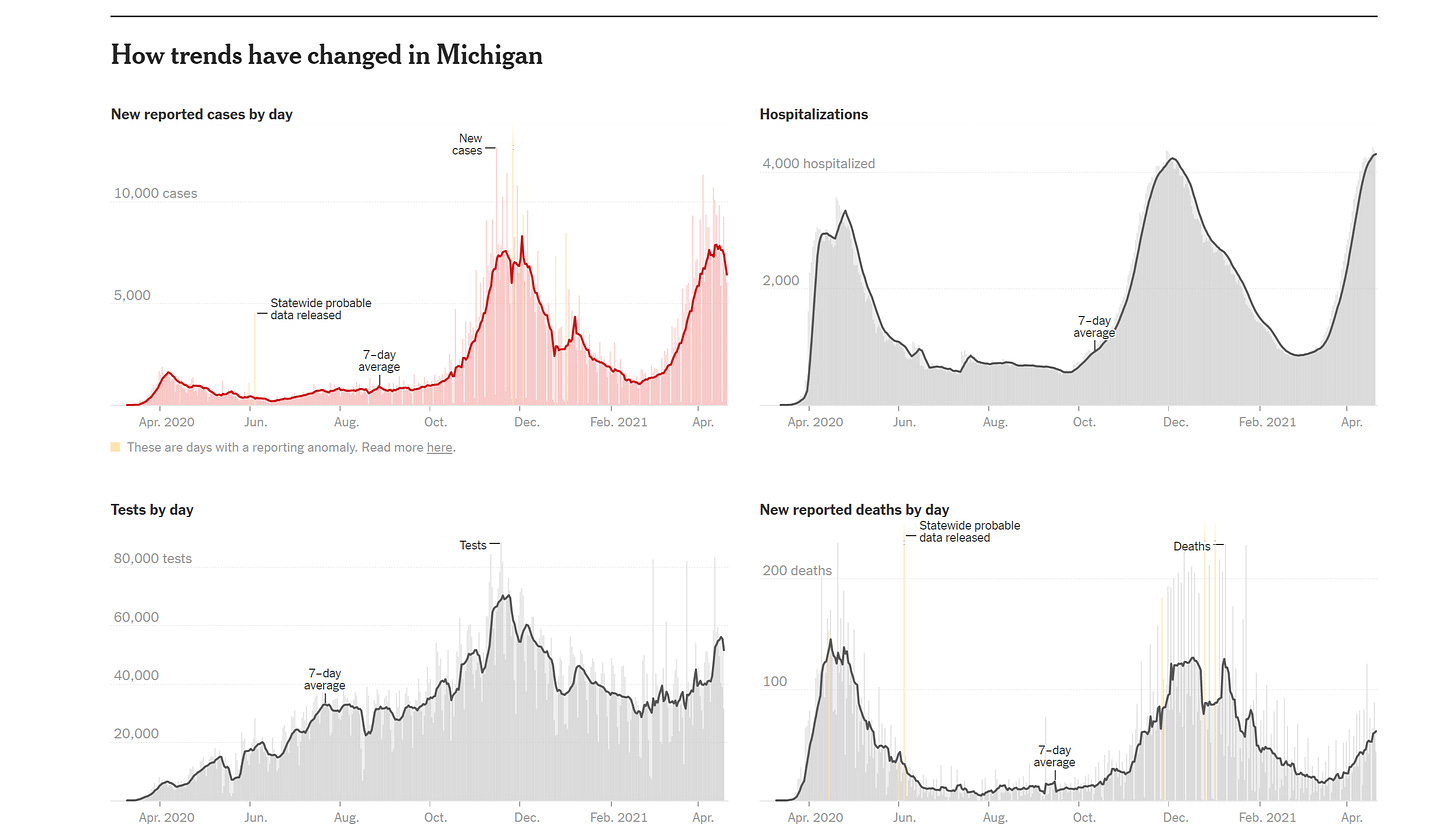
over the last 2 months, michigan has been an extreme outlier in the US on covid. it’s showing a major case spike, a rise in hospitalization, and even a rise in reported deaths.
while this sounds ominous, i suspect there is some manner of shenanigans going on here as their data simply does not make a whole lot of sense.
not only is it out of phase with the rest of the US, but the issue stops cold with laser-like precision right at the state line. i have never seen a disease act that way.
this is cases by county. (source NYT)
my immediate suspicion was that there was some massive spike in testing driving this, but that does not look to be the case here. yes, testing is up 83% since feb, but cases rose 600%, so this was not just an increase in sample rate. there was a big jump in actual cases. hospitalizations seem to confirm this, but that’s a notoriously tricky metric. this is where the data gets weird.
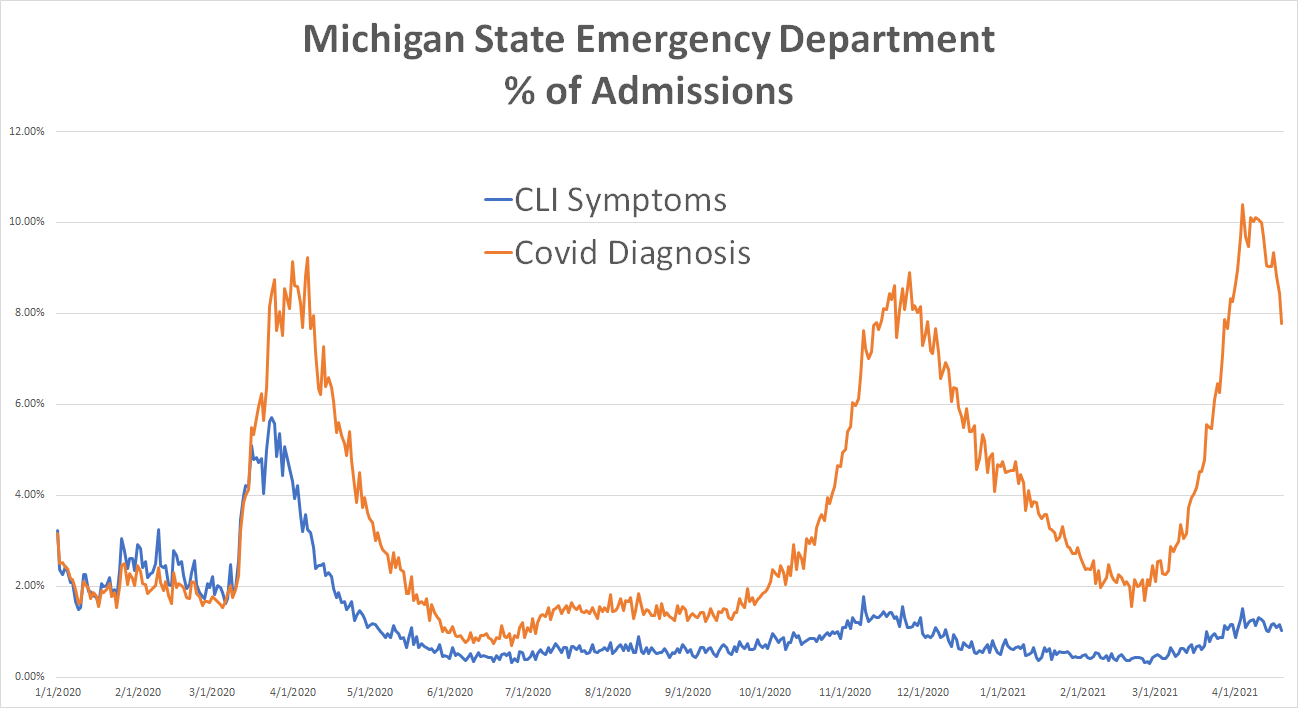
if one then looks at the data from the michigan ER admits, a very different pattern emerges. all ER’s now track admission for covid like illness (CLI). they also track covid diagnoses. this can be expressed as a percentage of all ER admissions. (raw data HERE)
in the past, we saw more alignment between CLI symptoms and covid diagnosis, but this really blew out starting in october, then dropped back down some, then really blew out again.
this is not typical of any respiratory disease i have ever heard of. even a 2:1 ratio of diagnosis to symptoms is enough to make you wonder about over-testing and false positives, but 7:1 is simply beyond the pale.
this means 1000 people walk in, 15 claim to have CLI symptoms, and 105 get a covid diagnosis.
this does not sound like an epidemic of a dangerous disease, it seems like some sort of really problematic measurement modality. this is, of course, precisely what testing asymptomatic people with high Ct PCR based genetic tests for covid has always been.
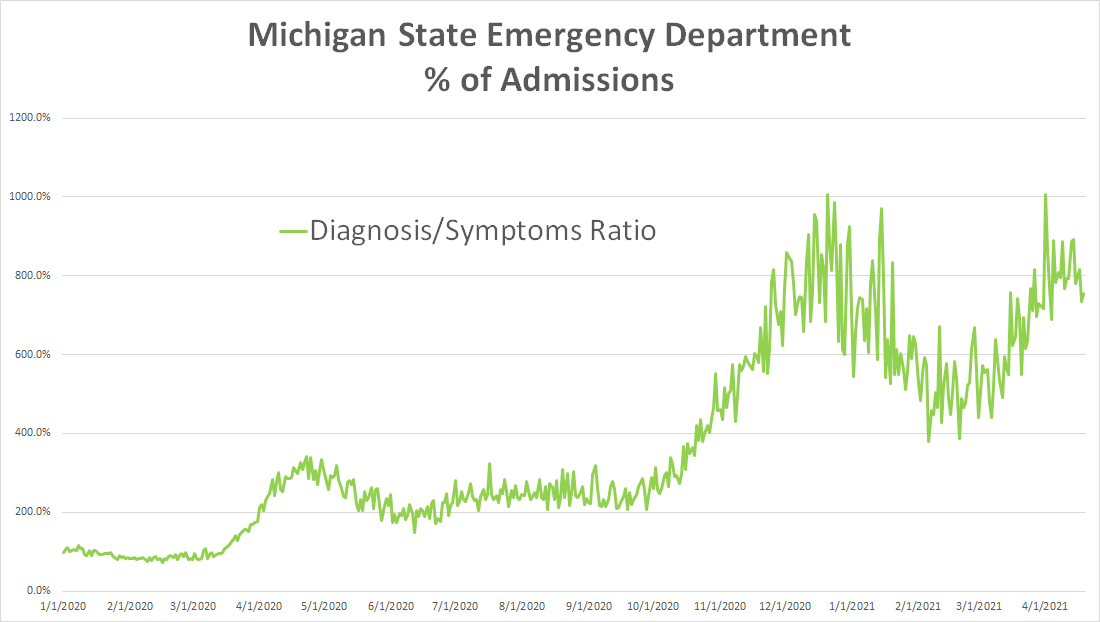
we can see the extent of the issue more clearly of we take the ratio of the two series (all data through 4/19/21):
the peaks of diagnosis to symptoms were 10:1 and readings of 8:1 were common in december, january, and april. so ~88% of covid cased diagnosed in the ER were people who were not there for covid and were not showing symptoms. that seems deeply implausible.
it also shows us why “hospitalization data” may not, in fact, be a confirmation of “case data” because the case data may, in actuality, be being driven by hospitals over-testing and/or having sufficient source contamination that far more people who walk in with covid test positive for covid.
they’re picking up trace levels in the ER and then a hyper-sensitive PCR test used (against clinical recommendation) on asymptomatic people “finds” it.
this is my leading hypothesis here. it looks to me like some sort of michgan specific hospital policy or contamination or change in testing modality (perhaps to antibody instead of PCR so past cases pop more).
this would explain the sharp line with which this “infection” stops that the MI border.
it would also explain the huge divergence in diagnosis from symptomatic presentation.
it would also explain the spike in “hospitalization” as each of these people will count (a big revenue win for the hospital) and some may stay for a 4 day course of remdesivir.
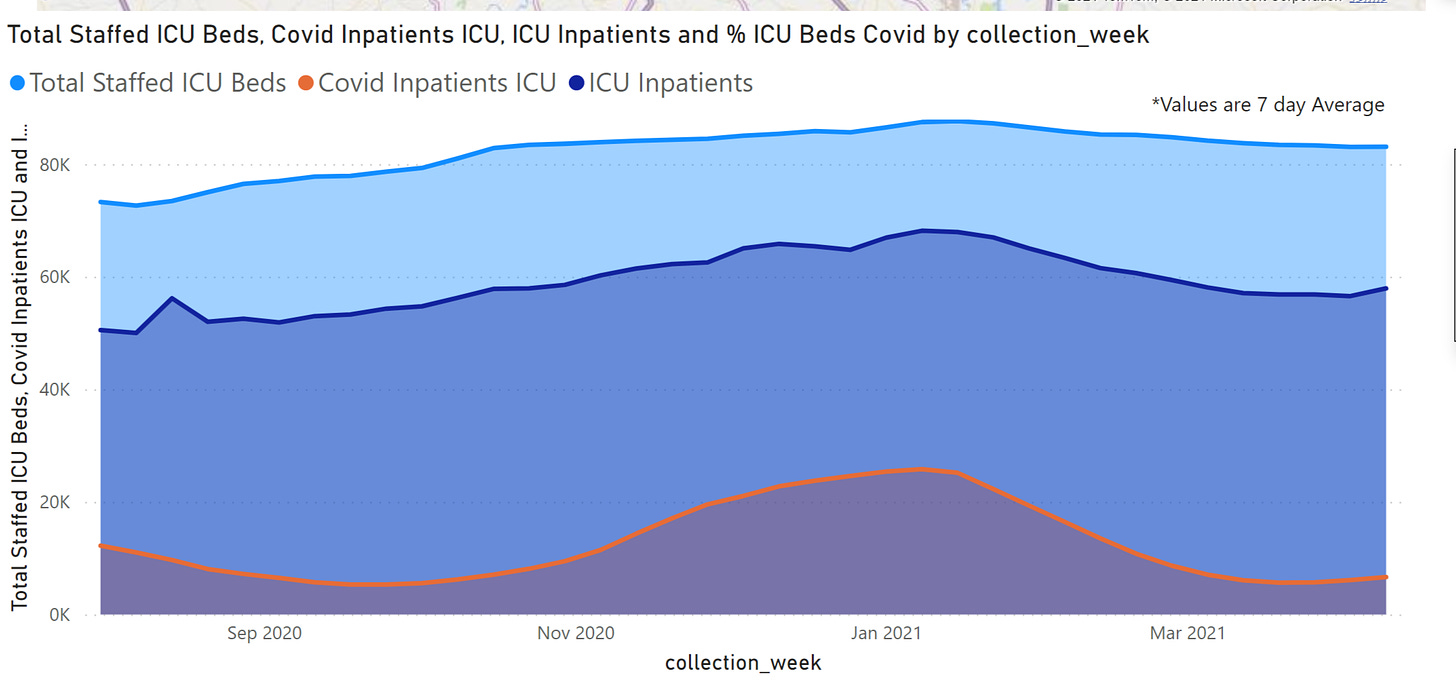
supportive of this is the fact that while hospitalization rates rose, ICU did not. they look like this:
this would be consistent with hospitals reporting lots of non-clinical cases from aggressive testing and contamination, but almost none of those people being sick enough to warrant ICU care.
assuming i am correct here, then the michigan surge is not some variant or some portent of bad things to come nearby or nationally.
if that were true, it would be spreading to neighbors. those theories never really held any water.
it means their data is, like so much covid data, riddled with artifacts and is reading wildly high because of some issue with testing policy and modalities. it means they are basing policy off of corrupt data and will get nothing but GIGO.
that said, i do not have any good data direct from the ground in MI on what is going on in ER’s and why they have such an implausibly high diagnosis to symptoms ratio. if anyone has firsthand experience with what they are doing, i’d love to hear it.


All it takes is a few testing sites that look like the BBC footage of PCR tests cross contaminating each other. If the virus aerosolizes easily, then it spreads in a lab and - boom - all the tests are positive.
One dirty lab could account for all of this. Without an open society machines get less maintenance, fewer people check on things in person, and obvious problems go unresolved.
Positive tests are not cases. As I stopped arguing with dave, asymptomatic positives should not to be considered in population prevalence, they may not be illnesses. Despite how some want to minimize IFR estimate.
The US started out trying to save the ICU system, quickly became zero covid, which quickly became zero positives from hyper sensitive tests. PCR at high Ct done randomly might show snap shot prevalence including old cases with fragment RNA, but I worry fragment RNA might be other than SARS CoV 2.
Michigan has begun a down turn of positives, seasonality effects the hyper sensitive tests too!.
Minor observation: 30 month old grand daughter sent home from day care went to Pediatrician: positive flu, in north Boston suburb.
Hope it means SARS CoV 2 viral interference is waning.