are covid vaccines reducing hospitalizations and deaths? (spoiler: it does not look like it)
a tale of two new englands and a hypothesis on the variance
many have claimed that covid vaccines, while clearly not suppressing cases, are lowering covid deaths and hospitalizations in the highly vaccinated states in the US.
but is it true?
spoiler alert: it does not appear so.
comparing states is tricky without age, risk, and seasonal adjustments.
but we can get around this by using each state as its own control/comparator group and comparing this high covid season currently underway with last year.
conveniently, the top 5 states by vaccination rate are all in new england and thus in the same seasonal pattern.
this eliminates a lot of potential confounds and leaves us with one major variable:
this year is vaxxed, last year was not.
when we do this, new england clearly bifurcates into two groups:
the north (maine, new hampshire, vermont) who are all far above peak 2020 numbers for cases and hospitalizations (though not yet deaths). compared to this date last year, they are WAY up.
seasonal peak would be expected to be the second week of january, so it looks likely to get worse before it gets better.
the south (massachusetts, connecticut, rhode island) are still well below 2020 peak numbers on hospitalization and deaths (though nearing them on cases). compared to this date last year, most are down significantly.
seasonal peak is roughly the same as the north and rates are rising. whether this is a delayed season from a warm autumn or an actual drop in the size of the covid wave remains an open question and a case can be made for each.
that said, the case that looks more or less impossible to make from this data is that vaccines are making any discernable difference. (and we can verify this with second source data.)
let’s look:
first off, vaccination rates are nearly perfectly identical. NH is slightly lower on 12+ but all are 92-95% in the critical 65+ demographic that accounts for most deaths and hospitalizations.
for a natural, society scale experiment you’re not going to get much better than this for uniformity.
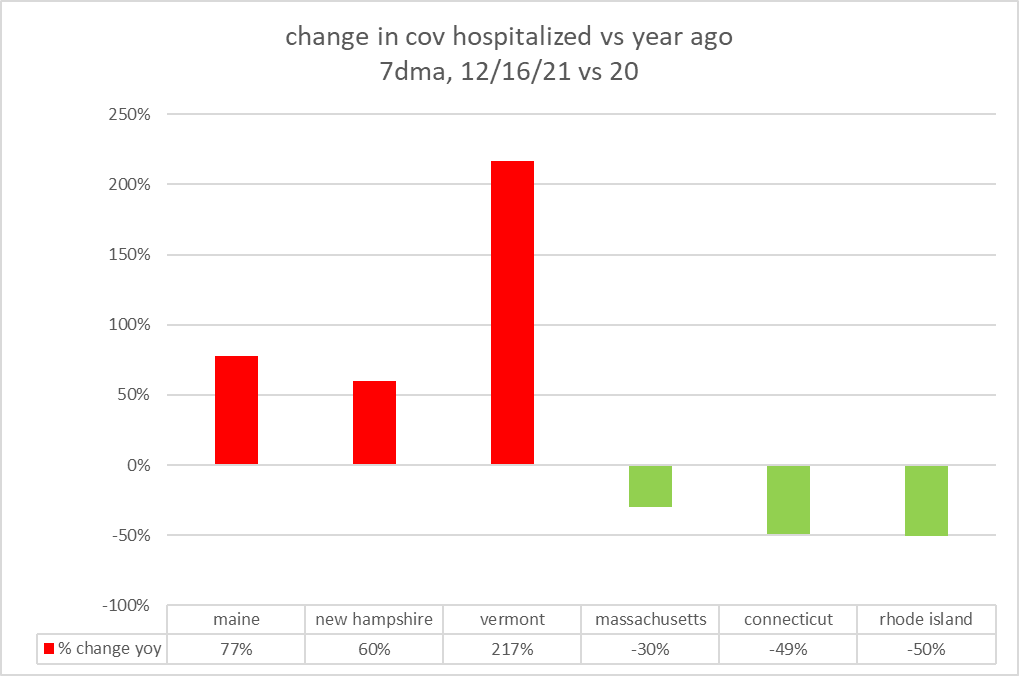
i then used NYT data to look at the 7 day avg of hospitalized covid patients and deaths for yesterday, 12/16/21 vs 12/16 the prior year in each state.
the divergence is striking.
the northern trio is way up. the southern, way down.
deaths look similar (but are a choppier series day to day with more noise and so a bit harder to read/compare reliably)
this enormous divergence despite near identical (and near ubiquitous) inoculum, especially among the high risk populations makes ascribing the southern reduction to vaccines look implausible.
clearly, there is another variable at play.
perhaps it’s latitude, but i am not so sure. the season does look to have started a bit later in southern new england this year and rates of hospitalization and death ARE claiming rapidly, but they also look to be little like the north in terms of vastly overshooting last year. (this is also confirmed in all cause deaths)
the variable that looks dispositive to me is naturally acquired immunity derived from disease recovery.
there is no really good or reliable data there on “recovered”, but based on the counts of cumulative covid deaths per million to date (which is a pretty good proxy and is not marred by testing level variance and programs in schools and all the other messes affecting “cases”).
there is strong reason to suspect a relationship, so it’s not random data mining.
the clustering is more than a little bit provocative:
contrast this to the plot by over 65 vaxx rate:
i simply see no way to look at this data and say “vaccines are working to reduce hospitalizations” especially as the north and south have opposite signs.
we can check these figures using an independent source of data that sidesteps definitional issues and the vagaries of covid counting: all cause mortality.
i deliberately did not look at this data until after formulating this hypothesis on the theory that it might provide some insight as to whether or not i was onto something.
then, i dipped once more into frequent gatocollaborator™ ben, from USmortaility.com’s data to assess.
the results are just what one would expect if it was prior exposure/vulnerable cohort depletion driving this variance.
let’s look:
first the northerly 3 currently looking worse on covid than last year (ranked by severity of hospitalization rise vs last year)
this is exactly what you’d expect. low rises in excess deaths last year lead to this year looking markedly worse.
now we look at the southerly 3:
all had much higher excess death last year and are now showing lower values this year. the inverse relationship by year is striking.
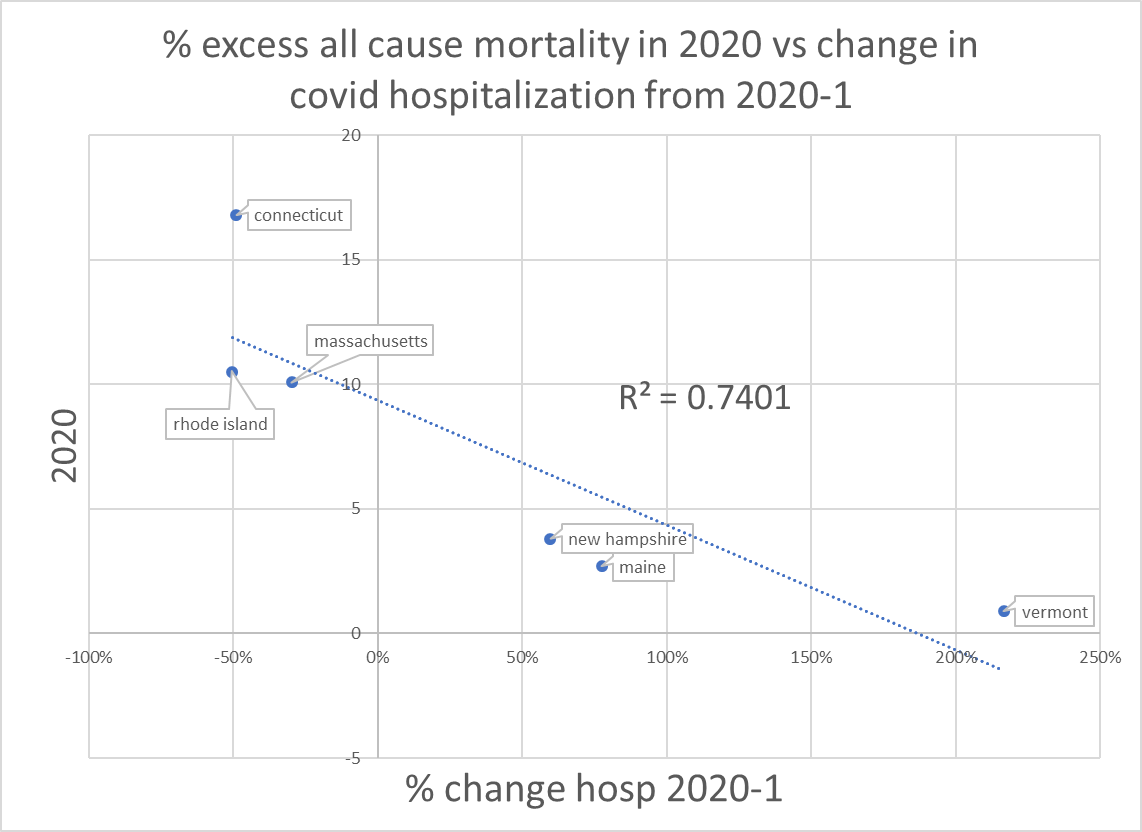
high values in 2020 beget low values in 2021. note that a .87 R2 is VERY high in a system this complex. this is a strong association.
i left out connecticut because it looks like a bit of a confound/special case. it’s a gigantic outlier in overall excess deaths.
i suspect this is a result of bordering NY state and so much commuter traffic from NYC.
but it makes a mess of the r2 in a series this small because that’s what major outliers do. i still find the pattern in the other 5 compelling and suspect this is CT being an “odd duck” somehow.
for completeness:
but in the end, we land here:
big excess death in 2020 strongly predicts lower hospitalization for covid in 2021.
all in all, this leaves me feeling like “the variance in current covid outcomes in new england is being driven by prior exposure and to no discernable effect by vaccines” looks like a strong hypothesis.
it could be the south will rapidly get worse (implying a lack of sufficient community immunity and that this was just a bifurcation of seasonal pattern). that would seem to be the most likely confound.
if this occurs but all cause deaths do not rise, that would be interesting in and of itself as a measure of overcounting of covid and so bears watching.
inevitably, someone will likely object “but it all would have been worse had there been no vaccines!”
to this i respond as follows: “what would you accept as falsification of that claim?” because it’s impossible to prove a negative and thus also invalid to make a factual claim that would require doing so to refute.
it strikes me as implausible that vaccines are working all over, but the variance all looks to reside in past exposure. if they work so well, why are 3 states way up while 3 are down? surely if this was just some more dangerous variant, it would be having an effect on everyone. so, i’m not finding that explanation convincing.
will keep up on this and keep pulling at threads to see what else comes out.


This is great. It supports a perfectly reasonable "dry tinder" sort of theory where the places that got blitzed before there was a vaccine now have solid herd immunity.
If that's true we have a second controlled experiment on the horizon: places that built up herd immunity the hard way (NY, Boston) versus the less urban places that have a higher prevalence of vaccination-based immunity. Will the vaxxed-only keep getting sick while the herd immunity places don't, is what is on my mind.
Some people are terrified of hospitals. Remdesvier, ventilators, administrators wanting money.
I'm going to bo like Amish... no testing, no hospitals...
I'll take my chances than be with evil folks