bayesian datacrime: defining vaccine efficacy into existence
how the definitions of "full vaccinated" and now "boosted" are exaggerating (and possibly creating from whole cloth) VE and turning the data into gibberish
welcome to another edition of “stats with cats.”
today’s topic: how to use definitional legerdemain to make products look like they work, taint data, and fool the unwary.
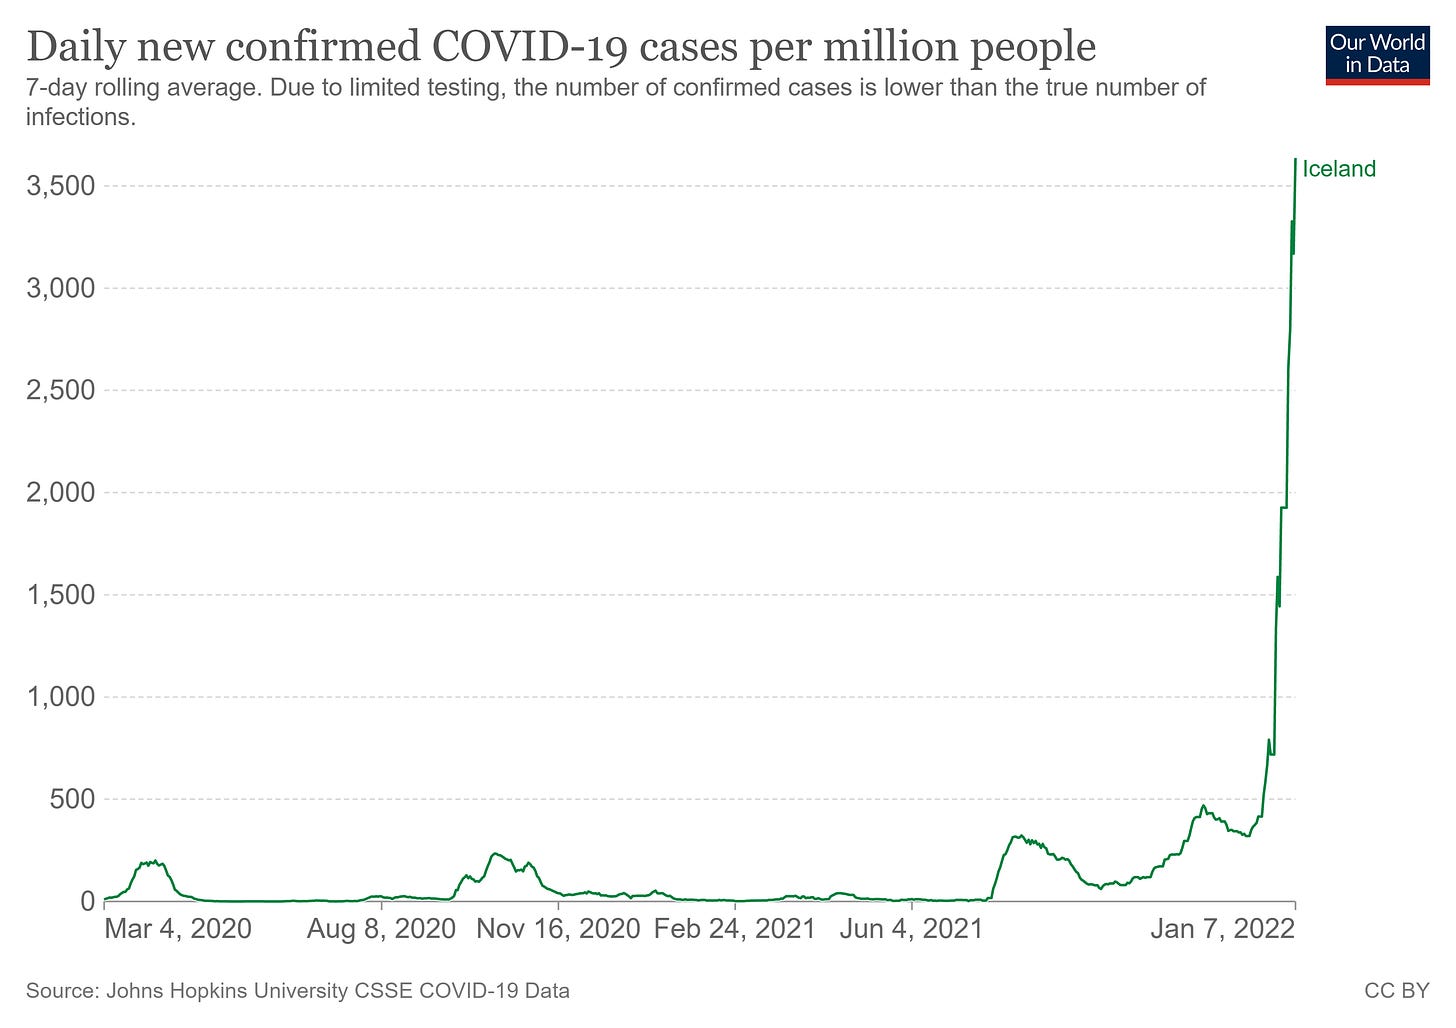
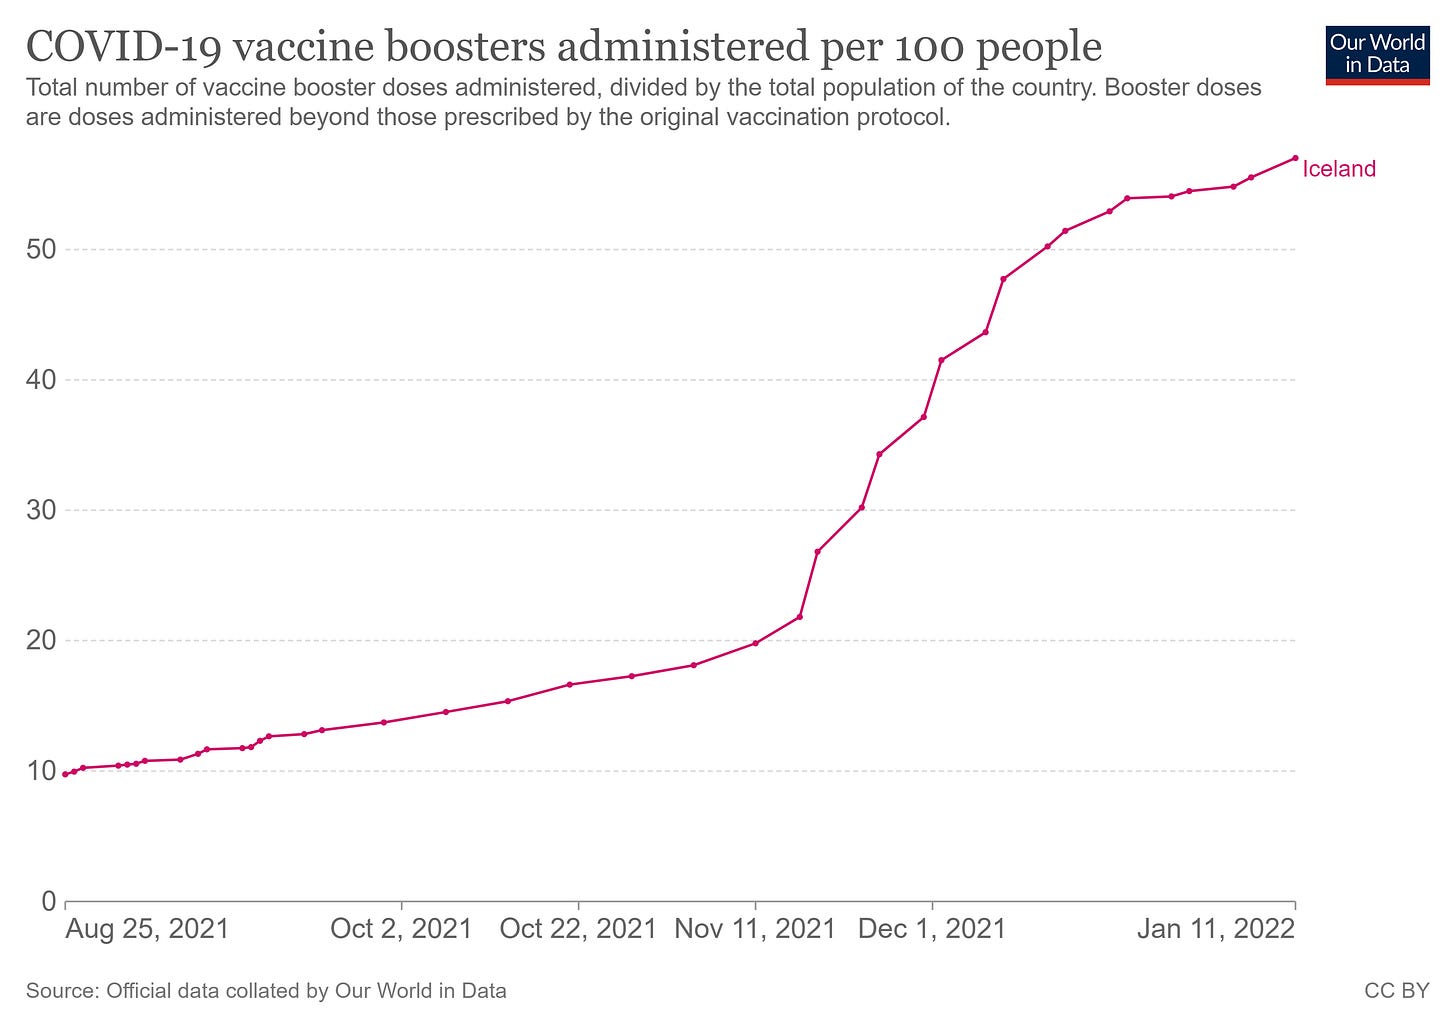
let’s start in highly vaccinated iceland where, despite ~80% vaccination rates and over 50% of the population boosted, cases are literally exploding.
testing roughly doubled, but this is still a DRAMATIC move even adjusted for sample rate.
many have argued that vaccines are helping. this data makes it look like they are not. the vaccinated are getting covid at something like twice the rate of the unvaxxed.
but, one might argue, this DOES make it look like boosters work. but this is not so either and that’s what i’d like to dig into.
you could hide hannibal crossing the alps on elephants in the definitional holes here.
this is just a fouling of the bayesian process.
let’s take a simple, contrived example. for this we will assume:
vaccines have zero effect on stopping covid. they do not make it more or less likely you will contract it. they are, literally, saline.
we have 200 people.
100 are unvaxxed.
100 are double vaxxed.
all have a 10% chance of getting covid each 2 weeks.
20 of the people who were vaxxed get boosted at the beginning of the period.
no one gets re-infected.
so what happens over a month?
of the 100 unvaxxed, 10 get cov first 2 wks, then 9 the second. 19 total. 19%.
of the 80 double vaxxed, 8 get covid first 2 wks, then 7.2 the next. 15.2 total. 19%.
of the 20 boosted, 2 get covid first 2 wks, then 1.8 the second. 3.8 total. 19%.
ok, so far, so boring. but here is where you want to pay attention, because this is where the trick resides:
you do not count the boosted as boosted until 2 weeks after the shot. this is the definition everyone has been using. it was used in the drug trials for these vaccines as well. and doing this is full blown bayesian datacrime.
in this society scale data, it has the following effect:
the 2 people in the boosted group who got covid in the first 2 week period get moved. they are not counted as boosted cases. they are counted as double vaxxed cases.
so instead of actual risk based on behavior, we get:
unvaxxed: 19 total = 19%
double vaxxed: 17.2 total = 21%
boosted: 1.8 total = 10%
and faster than you can say “record quarter for pfizer” you get apparent VE where there is none. we’re literally measuring saline.
boosters now show a 48% vaccine efficacy (VE) and double vaxxed falls to -10%.
and the faster you ramp boosters, the worse it makes double vaxxed seem. this literally becomes a product that sells itself because the statistical process is totally rigged.
if you up the number from 20% boosted to 40%, VE for double vaxxed drops to -36%. this makes the need for a booster look much more acute.
this makes it quite hard to take those curves at face value. they could mean all sorts of things.
this statistical sleight of hand from playing silly buggers with the definitions has literally taken a product (boosters) that has zero effect and made it look like 48% VE.
this same game was played with early societal vaxx studies as well except for the risk enhancement pre “dose 2 +14 days” was all shifted to the unvaccinated.
it would work like this:
100 unvaxxed, 19 covid = 19%
100 vaxxed, 10 covid first 2 wks, 9 second 2 wks = 19 covid = 19%
0% VE.
but, because the 10 cases in the first 2 weeks get shifted to “unvaxxed” it reads out as
29 unvaxxed = 29%
9 vaxxed = 10%
so you get 66% VE from saline.
this misallocation of cases and resultant mismatch of patient exposure days is a nifty little trick, no? (and yes, this is literally how most of these analyses are being done. to even approximate the boosted % today and comp to reported breakthroughs, you have to use the boosted rate from 2 weeks ago. this leads to the other common abuse/mistake:
mishandle the cohort sizes. this is easy to do if you take, say, boosted cases over a period of 4-6 weeks and then assume the boosted rate was whatever it is now instead of normalizing for exposure days across that period. this becomes extreme in its expression if the boosted rate is changing rapidly as it has been in so many places.
iceland boosted % went from 20% to 50% in a month.
let’s look at what that means.
let’s go back to our original case that “vaccine = saline” and 10% exposure every 2 weeks and look just at one 2 week period.
100 people. boosted b = 20 at start, 40 at end so “fully vaxxed” = vf = 55 at start and 35 at end. we’ll hold “unvaxxed” constant at uv= 25.
if each has 10% infection then using number at start we get
uv = 2.5 in 25
b= 2 in 20
fv = 5.5 in 55.
10 cases total, 10% in each. this is what gets reported and what gets expressed. it’s 0 VE.
but now apply the end of period cohort size instead now we’re reporting:
uv = 2.5 in 25 = 10%
b = 2 in 40 = 5%
fv = 5.5 in 35 = 15.7%
so, suddenly, double vaxxed looks like -57% VE and boosted looks like +50% VE.
but it’s all saline. no drug effect is present. we’re just not accounting for cohort size properly and counting “boosted today” vs “cases reported in those boosted 14 or more days ago” in a system with rapidly changing values.
this gets even worse as reporting lag for cases likely adds another 3-7 days.
this make collecting this data from society scale info VERY difficult and severely prone to error that adds strong, predictable bias toward making whatever group vaxxed most recently look like vaccine were working and to then have that apparent efficacy fade as the growth their group slows.
it’s not viral resistance or even drug fade. it’s just biased math. note that i am not saying that this proves there is no vaccine efficacy, though there is LOTS of data showing that (and negative VE on cases besides).
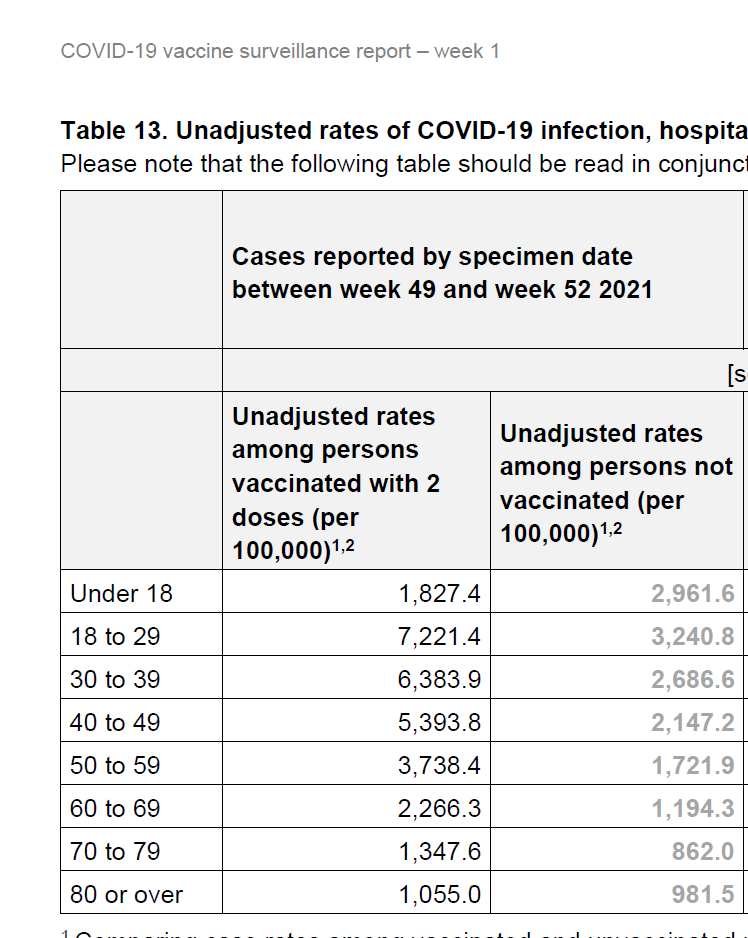
UK data:
i am pointing out a mathematical issue that is plaguing these analyses to the point of being outright datacrime.
this is pretty awful and governments, scientists, and health agencies alike are falling for it (or using it to manipulate data).
this is pretty outlandishly bad.
well, buckle up because it gets MUCH worse.
there is quite a lot of evidence that these vaccines trigger a ~2 week window of significant immune suppression. it has been shown to roughly double disease susceptibility in healthy people (and this was done during a period of low incidence and pre omi. it could easily be far higher now.)
a detailed walkthrough on this issue along with sourcing can be found here:
note the concordance here with the period of immune suppression and the definitions. this 2 week “worry window” of risk enhancement is exactly the period that these definitions will shift.
those who get a booster are, for at least 14 days, MUCH more likely to get sick. this is high hit probability fire to run across. the risk, in the middle of an omicron surge, is very high to begin with. this is not a time you want to be immuno-suppressed.
and if they do get sick, likely because they got the booster, they are not counted as a booster illness. they get counted as a “double vaxxed.”
so if we take our example above and add the new salient that those who get a booster are twice as likely to get sick in the first 2 weeks, now we get some really severe data shifting.
of the 100 unvaxxed, 10 get cov first 2 wks, then 9 the second. 19 total. 19%.
of the 80 double vaxxed, 8 get covid first 2 wks, then 7.2 the next. 15.2 total. 19%.
of the 20 boosted, 4 get covid first 2 wks, then 1.6 the second. 5.6 total. 28%.
clearly, boosted is the highest risk group in our example.
but it will read as the lowest.
this is because the 4 in the first 2 weeks will get moved. they get counted as “double vaxxed”.
so instead of actual risk based on behavior, we get:
unvaxxed: 19 total = 19%
double vaxxed: 19.2 total = 24%
boosted: 1.6 total = 8%
this definitional deception has literally taken a product that increased risk by 47% and made it look like 58% VE. note that this is UP from the 48% it reported as saline. yup, swapping in a product that does actual harm will, under these measurement modalities, read as HIGHER vaccine efficacy than saline. this calculation mistakes harm for benefit.
it works the same way if you mis-size cohorts temporally as outlined above.
if boosting continues at the same rate in the next 2 weeks you’re looking at 40% boosted at end of period AND the boosted group case count rises to 7.2 (36%).
you get a 19% rate in unvaxxed
but 7.2/40 = 18%. boosters look like they are working even though they had nearly double the risk rate.
and VE for “double vaxxed” implodes to -33%.
and we have not yet accounted for reporting lag.
or the fact that these two issues are not mutually exclusive and can compound multiplicatively.
play the same thing out in an initial vaccination campaign and you get:
100 unvaxxed, 19 covid = 19%
100 vaxxed, 20 covid first 2 wks, 8 second 2 wks = 28 covid = 28%
that’s negative 47% VE.
but, because the 20 cases in the first 2 weeks get shifted to “unvaxxed” it reads out as
39 unvaxxed = 39%
8 vaxxed = 10%
so you get 74% VE.
etc, etc. you’ve seen the patterns now, you can work these out further if you like. none of the math is difficult.
alarmed yet? because perhaps you should be starting to be. this is the act of a predatory card sharp not only palming a bad card out of their own hand, but putting it into yours while taking your best one. they are taking risk from vaccines and transferring it to those who did not take them.
this is like blaming “getting hit by a car while crossing the road” on “staying on the sidewalk.”
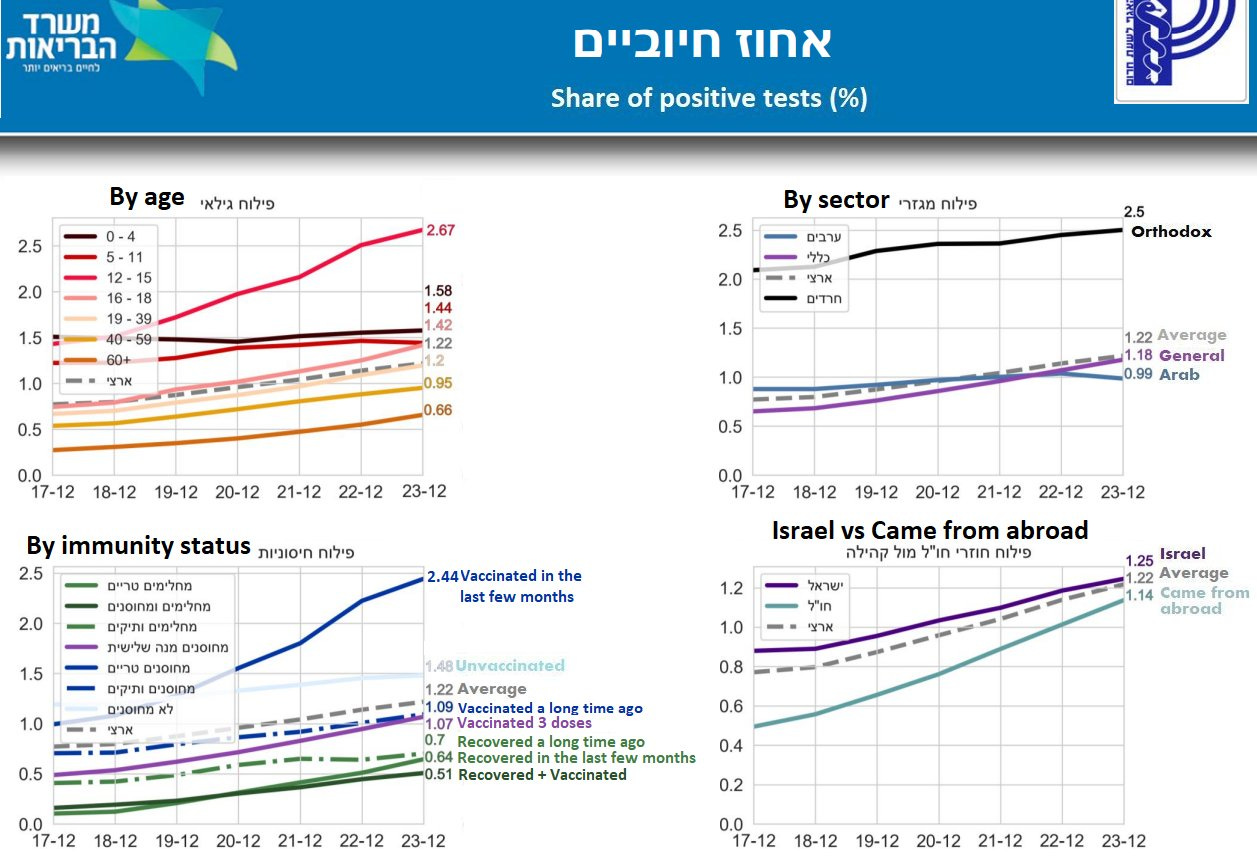
it pops clearly from the israeli data. look at the “vaccinated in the last few months” line (lower left graph). this is telling you that boosting during this pandemic is not working out at all well.
now, many will claim that sorting these figures by “per 100k” solves this issue. it doesn’t.
almost no one is doing it properly because the data to do it is largely non-existent. they think they are doing it, but in reality, unless you’re working from the medical records themselves and outright excluding all people who took a vaccine in the last 2 weeks from case counts altogether, your analysis is going to look like what i laid out. you’re getting the cohorting all wrong. almost everyone is.
even if you did get the cohorting exactly right, you’re following a group, not an individual and so your data is not meaningful for making personal choices. you’re measuring only the safety of the far sidewalk and disappearing the risk of crossing the road to get there. that’s not science. that a slimy sales pitch for rust undercoating.
even if you manage to avoid dropping people out temporally and getting the days of exposure imbalances above, it still does not prevent this issue because you are still “salting” the downstream cohorts in a manner that will ALWAYS preference the most recently vaxxed.
let’s go back to out example and add some reality.
we have 100 people, same 10% change of infection per fortnight. but this time we ARE going to manage the time shift with implausible perfection. let’s also move to some more realistic assumptions:
we have 100 people. 80 are double vaxxed. 20 are unvaxxed (or single vaxxed, a notoriously high risk cohort that generally could not progress to d2 because they had a bad reaction/were too weak).
of our 80 double vaxx, we take out 20 who have become “fully boosted” (d3 +2 weeks).
so we’re 20 boosted, 60 double, and 20 unvaxxed.
the booster campaign is ongoing and so is the vaxx campaign. so, 20 of the double dosed just got boosted but are in their 2 week “not yet counted as boosted” window. 5 of the 20 unvaxxed started getting vaxxed.
we presume, as before, that those taking any vaccine dose have a doubled risk of covid contraction for 2 weeks.
so what do the next 2 weeks look like:
the unvaxxed would have contracted 2 cases. instead, because of the 5 with a double risk, you get 1.5 cases from the 15 and 1 more from the 5 that vaxxed and get 2.5 total, 12.5%.
the vaxxed would have had 6 cases. but, because 20 boosted but are not counted as boosted you get 4 cases from the 40 that are still on d2, and 4 from the 20 who got d3. 8 total cases, 13.3%.
the officially boosted get 2 cases. none are in the high risk window. 10%. keep in mind this is just baseline and the presumption is that post risk window, there is NO efficacy from vaccine.
but is sure looks like there is. booster shows 20% reduction from unvaxxed and double dosed slides to -6% VE.
where this gets REALLY interesting is what happens if the unvaxxed stop vaxxing. that drops their infection rate to baseline, 10%.
now, boosters have zero VE but double dosed efficacy drop like a rock to -33% because we’ve moved the unvaxxed rate to which they are compared so much.
this is a pattern we keep seeing in reported data.
the way these terms are being defined causes a risk cascade downstream and will always favor whatever group become “fully vaxxed” most recently.
it’s a mathematical rig job. (and i doubt very much it was an accident, this definition was not chosen out of hat. it was selected by highly sophisticated drug developers to occlude an issue of which a struggle to imagine they were not aware.
we can slice this 30 different ways, but it’s easy to see how perverse and error riddled this rapidly becomes.
even, if by some miracle of measurement, you followed JUST the patients and perfectly accounted for ALL cohort size issues and shifted none of the excess cases from risk periods into any other group, you STILL would not get the right answer because your sample would still be salted with injected bias because of the sequential selection effects.
consider:
you take 100 people at time 0. none are vaccinated. like any sample of real people, their risk will vary greatly from person to person, likely by orders of magnitude.
you start vaccinating. those who manage to get to “double dosed” without catching covid are already sorted to be the strong. the highest risk had that risk doubled and do drop out of the “uninfected.” then, cull it again for boosters. pretty soon, you’ve got only the best immune systems in the “boosted but never sick” group.
this gets confounded further because those that vaxx have higher risk, at least in short run, of getting covid. many will. but after they recover, they stay in the “vaxxed” or the “boosted” groups. so those groups will have higher immunity overall simply because they are all more likely to have had covid and recovered. try separating THAT from the pharma signal in society scale data… mostly, you can’t. most of the people who have had covid never actually tested positive for it. it’s literally impossible to know those numbers.
that has turned this data into outright junk that is hard to handle in a meaningful fashion and toxic to generate policy from.
this is WHY randomized controlled trials are used. you need to get all the bias out and equalized BEFORE you start. there is a reason that study design and enrollment randomization and balance are a whole separate subfield. once the data starts getting confounded in complex ways, you cannot untangle it. you’re lost.
ending the vaccine trials so early and eliminating the control groups by vaccinating them was a massive mistake (or a deliberate dodge). that was our one shot at any real long term understanding and it’s long gone.
this issue around dropping the two risk enhanced weeks has been with us from the beginning. it was baked into the drug trials as well and folks like pfizer do not make mistakes about issues like this, they make choices.
there was some meaningful weirdness in the flow through of their trial that has never (to my knowledge) been satisfactorily explained.
there was an awful lot of dropout in the active arm vs placebo in the 2 weeks after dose 2 but before they started counting results. given what we know about such periods, this seems to warrant some pointy questions that i never even saw asked, much less answered.
there were only 927 cases of covid reported in the whole trial combined so these dropout figures could hide all manner of things.
whether and what they did seems a key question.
the agencies that are supposed to call them on such skullduggery and subterfuge instead helped them hide the evidence and have fought like hyenas with bones not to release the data.
i’ve never seen this sort of concerted collusion before to not only push the unproven upon society at large, but to slant the data used to do so.
it has become a hall of mirrors to bury signal in noise and boosters are being approved without any publicly available clinical data at all.
note that these tactics will work literally forever even with products that generate net harm so long as you are always “boosting” in large quantities in rapid surges. but once you stop, it all falls apart.
this does NOT generate incentive sets for pharma or the regulators who enabled and mandated this that align with the actual health of the public. it’s booster upon booster, on and on world without end. that is the only way to keep the plates spinning on the poles.
it looks like the courts have sided against the FDA and their bizarre “55 year data release plan” and are, at least for now, demanding release in 8 months, still likely too long to make much difference and a ridiculous position given that they clearly have it, clearly organized and analyzed it, and approved drugs based on it. if they do not already have it in one neat package, what are we to infer about the diligence of their EUA and approval?
but the data will come out. and you know who is looking forward to getting some paws on it…


I've pointed this out time and time again. This is part of how the trick is done with rates per 100k, the unvaccinated cohort gets smaller and the vaccinated bigger while the vaccinated cases count as unvaccinated. It's fraud. There are dozens of problems with it and no honest person thinks it is fine. The fact governments and scientists all over the world are ok with it shows that none of them are honest.
I have been explaining this to my friends who are Doctors, and they can't even do the simple math to understand it. They did all go to California public schools and colleges so that probably explains it.