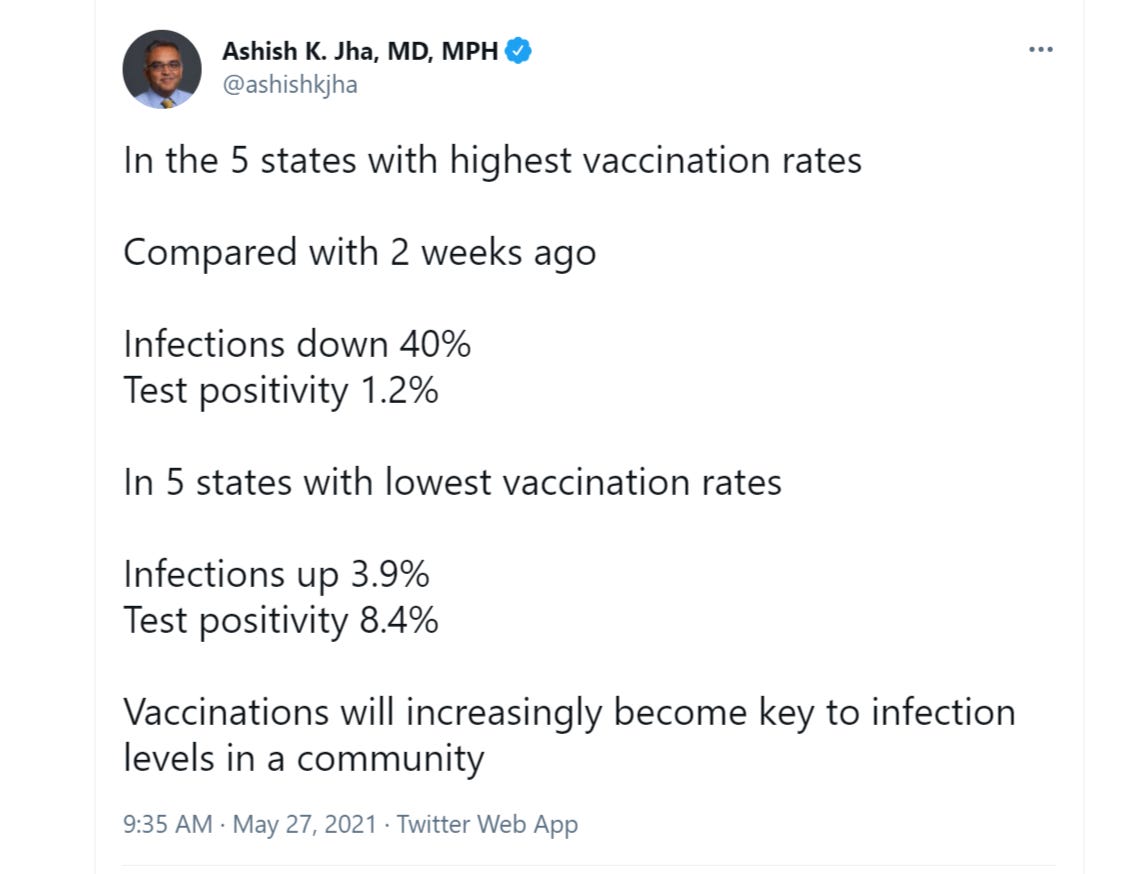
sometimes you see a claim that flat out does not look plausible or even possible.
this was one of those claims and, alas seems to be pretty representative of dr jha, shame of my alma mater and its school for med student dropouts (aka, public health)
infections up over the last 2 weeks in 5 states represents quite a sensational claim, especially without citing any data or data source.
being a gato of skeptical bent and fastidious data habits, i decided to check on this “fact.” it appears invented from whole cloth.
using “our world in data” i found the top and bottom 5 US states by vaccination %.
i then used the worldometer data to look at the 7 day moving avg of cases per day in each state on may 12th vs may 26th (the most recent data available)
here it is. please feel free to check it yourselves.
this is a FAR less dramatic outcome. it’s -53% vs -35%.
higher vax states did outperform, but every state but WY on the least vaxxed list showed a significant drop and WY is awfully low in absolute terms to look worrying.
there is also regional concentration. the top vax states are all clustered in the NE and the worst performers on the non-vax list are all mountain west where summer comes late. this could easily just be a regional/seasonal issue.
guys, there is enough acrimony here and misuse of data that we REALLY don’t need to go around literally making stuff up, especially those among the purportedly “credentialed class.”
when you “experts” gawp and sputter and wonder why no one trusts you anymore, well, this is the kind of behavior that caused it.
if your agenda is good, it should have good data. if it needs bad data to sell it, well, then it’s a bad agenda.
this is science, not scientology.


In your analysis did you include the fact that test positivity was confounded with lower Ct for post-vaccination testing? As such, positivity rate. i.e., cases, would go down *regardless* of actual positive effects from vaccination. Or, I may have missed something!
Johns Hopkins has least vaccinated states as AL, AR, LA, MS, WY, so I will use that. What am seeing is that (CT, MA, ME, RI, VT) went down 54% last 2 weeks of May 2021, but also went down 38% same time in 2020. For (AL, AR, LA, MS, WY), they went down 12% last 2 weeks of May 2021, however during same period of 2020 they saw cases RISE 38%. Dr. Jha's analysis (even forgiving the wrong numbers) will end up being cherry-picked time range (like the Kansas masking "study").