US covid test positivity rates by vaccination status
yet another set of evidence that vaccines are not working to stop covid spread and that boosters wind up making you more likely to contract covid in the long run
it has been notably difficult to get covid data by vaxx status in the US. the epic records are a mess and deeply undercount the vaccinated and the health agencies have been playing all manner of games. however, it appears that private industry may be coming to the rescue here (and once more shedding doubt on why we need the CDC to aggregate anything). walgreens, who perform large amounts of both testing and vaccination are now publishing data conveniently assessable through a power BI interface. it’s got quite a lot of useful information. huzzah.
spoiler alert: it does not make the case for vaccines preventing infection.
it’s clearly associated with much higher infection rates and boosters are faring worst of all.
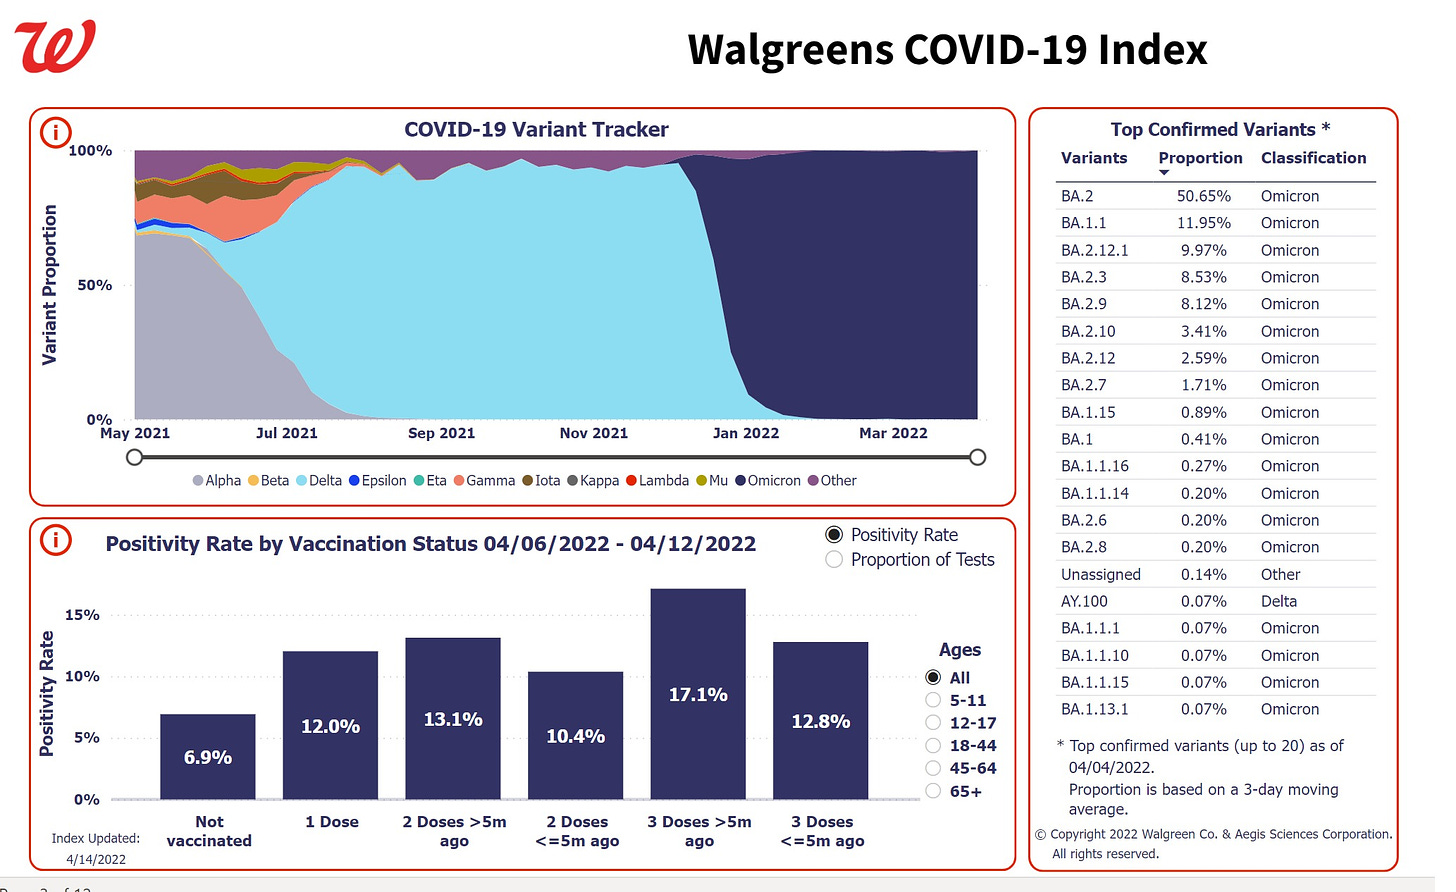
we start here:
as can be seen, unvaxxed is outperforming every other category in the overall standings. vaccine fade from the <5 month category to the >5 month is also clearly visible.
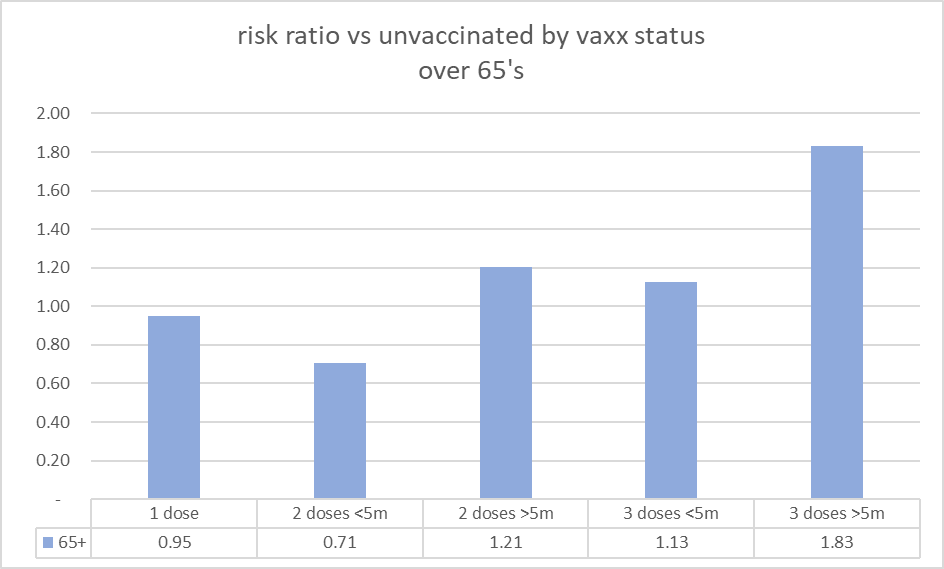
i always get nervous about simpson’s paradoxes in all ages data and that we might be seeing skew of vaxx status by age. fortunately, this tool lets us slice by age. having done so for all age groups, i found only two cohorts in the entire dataset where vaccines are outperforming unvaxxed. both are here:
in over 65’s, 1 dose slightly outperformed (0.95 risk ratio) and 2 doses less than 5 months ago looks to have materially outperformed (0.71 risk ratio). unfortunately, this outperformance appears transitory. 2 dose > 5 month is a 1.21 risk ratio. you can see the full set of ratios here:
the sawtooth pattern here is telling and indicative of rapid vaccine fade. 2 dose looed to work pretty well for a while, then they flipped to being net harmful. getting a booster seems to have, for a short period, reduced that harm slightly (1.21 drops to 1.13) but then went on to leave you considerably worse off post 5 months than if you had not boosted.
this is consistent with the data from sweden 6 month ago.
and based on how rapidly VE is dropping and relative risk ratios are blowing out in the UK (likely due to virus evolving to use non-sterilizing vaccine mediated antigenic fixation to advantage) the swedish data is now likely optimistic. BA.2 seems to be far more adept at vaccine evasion/acceleration.
clearly, there are lots of possible confounds and selection biases that are possible here on timing and underlying risk guiding booster election, but all in all, this data is pretty provocative and would seem to argue that more doses is just digging the hole deeper for you in the long run. that would seem to be the opposite of a vaccine and more akin to an immuno-suppressant.
whether the short term effects are even real is also an open question as the definitional issue of only counting as vaxxed or boosted those 14 days + after the dose can badly skew the data.
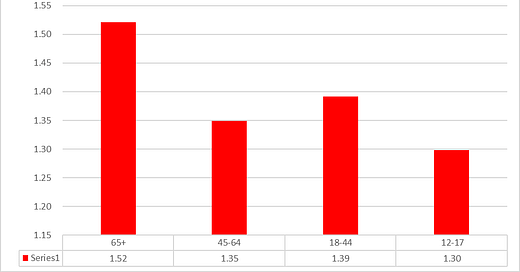
this alone would be worrying data, but, alas, it gets worse. over 65’s were an anomalous age bracket. all the others were worse and not a single vaccinated cohort outperformed unvaxxed.
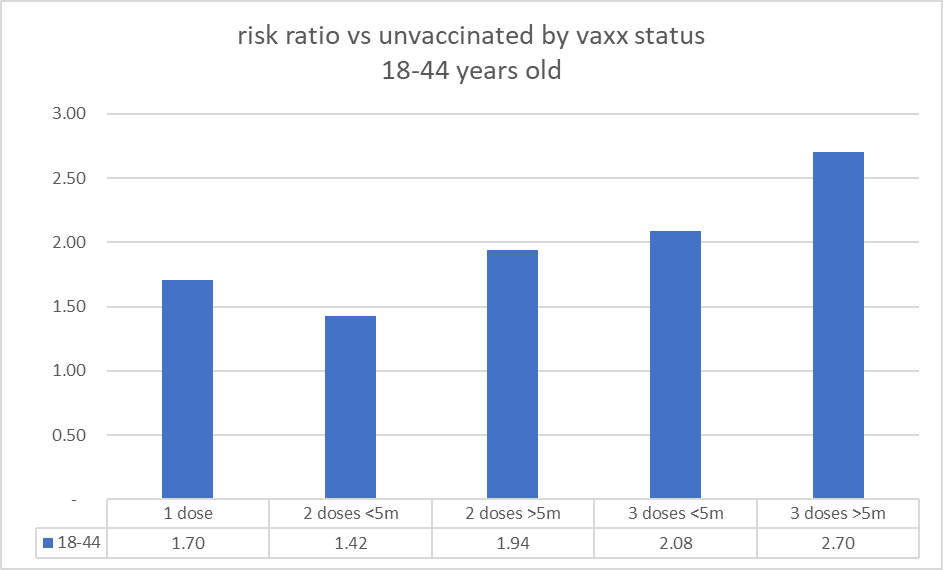
we see the same sawtooth, but the overall relative risk ratios are MUCH higher than in the over 65s’ and they never dip below 1 (which would indicate vaccine efficacy).
it gets even worse in 18-44.
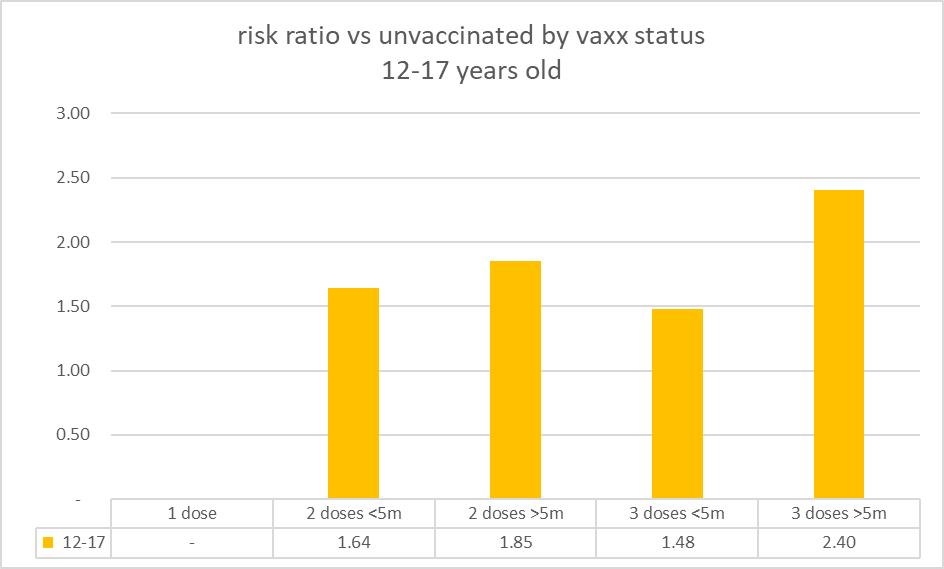
and here are the rest:
as can be seen, no cohort is experiencing positive VE vs infection.
i would LOVE to see a temporal spread of this data to assess whether and to what extent the risk ratios have been changing over time (akin to this analysis) my hunch is that they have, indeed, been rising. if anyone knows how to get that data here, please let me know.
this is all looking pretty bleak, but the really nasty take away from this data is not just the negative VE, but it’s the fact that it looks cumulative.
when we compare the VE of boosters after 5 months to 2 doses after 5 months, it’s severely negative (the relative risk ratio is >1).
this increase in risk appears to be in the order of 35% for most but manifests more intensely in over 65’s.
obviously, this is not RCT data and confounds are possible, but this is certainly suggestive of significant problems.
taking this data at face value, the best case is that boosters make you a little better off for a short while vs having been double dosed more than 5 months ago, but that in no case do they get you back to a level better than the unvaxxed. then, over time, they get worse and in every age group leave you more prone to infection than those that did not boost.
this raises some very pointy questions about long term immune system dame or deeper levels of antigenic fixation.
the FDA’s continued and concerted determination to ignore this and base approvals for boosters unto infinity based on proxy data and biomarkers is just a stunning lapse. i struggle to find an explanation of simple incompetence credible at this point (though, of course, their two top vaccine people already quit in disgust over the politicization…)
when government becomes the marketing arm of big business (especially big pharma) we the people get get harmed.
it’s long past time for a very serious assessment here over just what the role of regulatory and public health agencies has become.








In other news, California has "pushed back their school Covid vaccine to July 2023", which really means they have abandoned it in complete and utter defeat. No effing way they actually implement it in 2023. Congrats Californian readers!
Also consistent with the UK data, which they have stopped reporting 🤬, but all past reports are collated here: https://public.tableau.com/views/UKReportsRiskRatios/UKCharts?:language=en-US&:display_count=n&:origin=viz_share_link