covid heads north for the winter
the US northern states paint a worrying picture of the season to come.
covid, a highly seasonal virus, looks to be surging far earlier and more intensely in the northern US this year.
many have looked at this, myself included, but i wanted to take another shot at quantification here to see if we can get a picture that helps us see what’s coming.
to this end, i took all the states on the US northern border (excepting PA and OH, as they do not really count, barely touch, and have no population there.)
it’s hard to compare northern and southern states due to highly differentiated seasonality and the south now winding down its season as the north starts to wind up, so i chose to use states as their own controls. this also keeps demographics etc out of the picture. we’re just looking at “how is this year vs this time last year?”
i then grabbed their charts from the NYT and made a montage (in 2 parts, running west to east)
the red lines are hospitalizations and deaths on 9/29/21 (most recent data) vs the same day last year. all are 7 day moving averages to avoid day of the week fluctuation issues and to smooth the trends. data from NYT.
we would expect, given the rise in acquired immunity and in vaccination rates (which were zero this time last year) that even if vaccines are non-sterilizing but do have an effect of severity, that we’d be seeing a big drop in hospitalizations and deaths as delta is a far less deadly variant with lower hospitalization rates and that is not due to vaccines as delta case fatality rate (CFR) is actually rising as vaxx levels rise.
unfortunately, what we’re seeing is very much the opposite.
as can be readily seen, this does NOT look good vs a year ago. in every single state on the northern border, hospitalizations are up from last year ranging from up 35% in north dakota to a whopping 2100% rise in vermont.
deaths are also up YoY in all states but north dakota. vermont and maine lead the pack at up 2200% and 2000% respectively. (albeit off low bases)
i plotted all these states below. they are not normalized for population, so the raw numbers are not terribly comparable between states.
the real focus here is on percentage change year to year by state.
and it’s GRIM.
these surges are WAY ahead of last fall and we are not yet anywhere close to what is usually even seasonal ramp up in most places, much less seasonal peak which comes in early january.
perhaps this is just temporal shift and an early season, but as a number of these states are nearing or have already broken out to levels higher than their peak seasons last january, i doubt it. it looks like something else. whatever it is, this is a seriously worrying trend, especially given the vaccination rates.
BUT, and this is a meaningful but, there is a complicating factor.
cases are way up, even if we adjust for testing levels, and this seems to be driving a lot of what’s going on.
so, i added some more lines to this chart. i took the raw rise in cases (using sept 26th as that was the most recent day for which testing levels data was available) calculated the raw reported change year on year, and adjusted it for the changes in sample rate from testing level changes.
i then used this adjusted cases level to adjust the hospitalization and deaths data.
this does not mean they are really lower. they are not. they are way up.
my intention here was to try to get a sense of something a bit different: how much of the rise in hospitalization and deaths is due to the rise in cases?
in hospitals, it turns out to be all of it and then some.
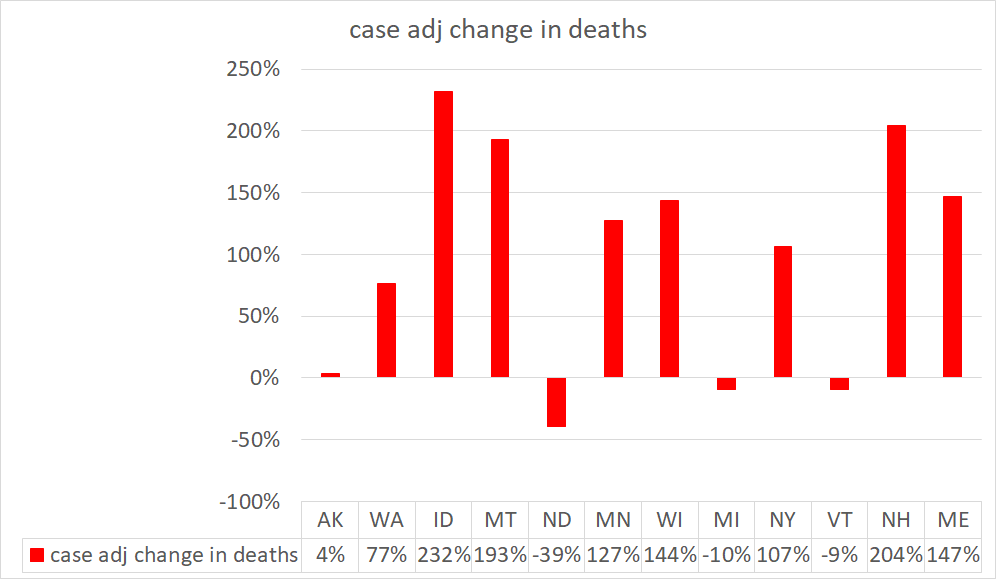
but in deaths, we see a different picture with the increase in death rates significantly outpacing the rise in case rates.
honestly, this divergence is something of a mystery to me and i’m still fishing for explanations.
how could median case hospitalization rates (CHR) be down 17% while median death rates are up 117%?
this would seem to imply that those getting sick enough for hospital are dying at 140% higher rates than last year. (or that a lot of deaths are non hospital)
this also drives home another fact: there is simply no mathematically plausible way that this is an “epidemic of the unvaccinated.”
case counts cannot be up 220% as a median in the US northern states if vaccines are sterilizing. only about 32% of over 12’s are vaccinated and under 12’s are not driving this.
if vaccines were perfectly sterilizing that would imply that 1/3 of the people were causing 220% of the spread and that delta was 660% more contagious. absolutely no one serious can make such a case.
a secondary attack rate (SAR) in the mid 11%’s vs 8% from alpha cannot account for anything remotely like that. and it’s not even clear delta has a higher SAR than alpha anymore.
this may point to negative VE’s from vaccines. this shows up in the UK data.
vaccines show efficacy in reducing hospitalization and death for delta but, based on the last 2 week interval in the UK variants of concern reporting, the negative VE looks to be about -16% for cases.
this is not nearly enough to account for this huge rise in cases even in conjunction with a 42% higher SAR. 1.42 X 1.16 = 1.66 = 65% predicted gain.
we’re looking at something on the order of 4X that (and in a population with more acquired immunity which IS sterilizing.)
this brings us back to the vaccinated superspread hypothesis where large number of people with leaky vaccination are actually kicking the whole pandemic up into a different valance and adding new and potent asymptomatic spread vectors that were not there before.
i am still not seeing a better explanation. it’s not just delta, it’s not just negative VE. we may be seeing some acceleration from the two week window of high vulnerability post vaccination as we saw in israel and palestine, but given the already very high rates of vaxx in the vulnerable communities in the US north and the lowish current vaxx uptake levels, this seems an less likely culprit here.
we also see some interesting confirmation in the fact that unlike the other variants, the CFR of delta has been rising, not falling. it’s still well below alpha (1.1%), but it’s basically twice what it was a a few months ago.
this is counter to expectation and to the general gradient of evolutionary pressure. higher fatality is maladaptive to maximizing spread which is what genes do.
it’s like seeing water run uphill.
when you see such things, it’s generally because some other force is working on the system. leaky vaccines have been known to do this. they select for hotter, deadlier variants.
this would seem consistent with the idea that the vaccines are now the big driver of viral evolution and perhaps spread.
the lower hospitalization per case rate but the much higher death rates are a bit of a puzzle.
all but 2 states saw CHR drop. (i have no idea what’s goin on in idaho. their adj cases are up quite little but their hospitalization is exploding. i suspect a data issue, but i’m really not sure. if anyone has any thoughts, please chime in.)
but all but three saw CFR rise.
my best guess here is that there are fewer severe cases, but that the cases that are severe are considerably MORE severe.
precisely what would create such a situation is a matter of some speculation.
it could be a set of evolving “hotter” variants within the delta strain that affect some and not others
it could be higher viral loads affecting some who come in contact with superspreaders. perhaps loading dose is having this effect
“breakthrough” cases are selecting for those with high vulnerability/weak immune systems and so only the high risk are getting hospitalized leading to higher death rates as a %.
it could be that vaccines are, in some, causing reactions that lead to cytokine storms or other autoimmune cascades. such things have been seen in other leaky vaccines (like dengue).
it could be some sort of statistical issue where count of hospitalizations is being depressed or deaths overstated. this seems unsatisfying on hospitals (as counting is more, not less inclusive) and deaths, while overcounted, seem to be being counted the same way as before. so i’m inclined to discount that.
it could be a lot of things or a combination of things. if others have plausible theories on this, i’d love to hear them.
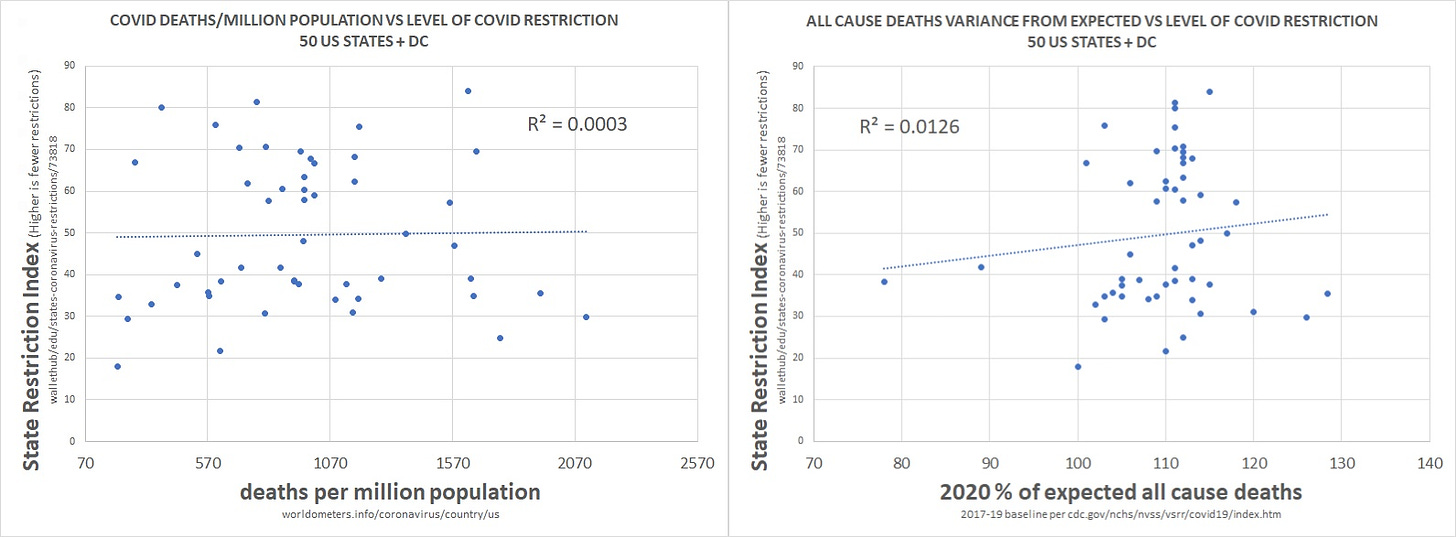
and no, it’s not “less lockdown and less masking.” it’s clear that none of that ever made any difference.
but one thing seems clear: something is going seriously wrong here. with all this immunity and vaccination, there is no reason we should be seeing such an explosion of cases, hospitalizations, and deaths unless we’re fundamentally altered the equation in some important way. the variants do not seem to explain anything like this size of surge or its off season nature.
if these trends hold, we could be in for a rough winter.
and


One thing I haven't noticed others talking about are 'incidental covid hospitalizations' as it pertains to regular hospital activity. We know that 30% of covid hospitalizations are pregnant women, who MUST be in the hospital. But many other things were delayed last year. This kept people out of the hospital and out of the 'incidental covid hospitalization' bucket.
This year, more hospitals are back to 'regular' activity. Therefore you'd EXPECT 'incidental covid hospitalizations' to increase because now it's not just the pregnant women coming to the hospital for other reasons, it's EVERYBODY who 'normally' goes to the hospital.
How about this for a hypothesis: Deaths caused by the vaccines are being counted as Covid deaths. People are being rushed to the hospital as a result of an adverse event—say, a stroke or heart attack—where they “test positive” (perhaps from some residual virus in the nasal passage) and the COD goes down as Covid. Is that plausible, given the data? It might explain the fewer hospitalizations/more deaths conundrum.