whether schools are safe or pose high risks of pandemic spread has become a politically controversial topic.
this would seem to speak poorly of politics as this is NOT a scientifically controversial topic based upon any good data i have seen. the near unanimity with which the evidence fails to support any added risk from school opening (and, if anything, shows that a return to school reduces risk) is really quite striking. anyone watching SWEDEN (SWEDEN2) has known this for nearly a year. the CDC knows this as well.
you can read the studies. their results are clear and seem, thus far, impervious to factual refutation or counter-claim.
the CDC study shows infection rates among students and staff in schools were 37% below the rates of their communities as a whole and that even among those infections that did occur, only 3.7% were linked to transmission in schools. this is not looking like a threat vector.
but, some might argue, this is just wisconsin. perhaps this has nothing to do with the facts on the ground in other places, urban schools, etc. it’s not an unreasonable conjecture. let’s see how it stands up.
(all data in the following analysis comes from the covid SCHOOL RESPONSE DASHBOARD created by brown university professor emily oster, who has been doing my alma mater proud with her great work pulling this together.)
i collated her data and plotted it by time in the 4 cohorts she breaks out: schools >90% in person, 60-90% in person, 30-60% in person, and fully remote. i looked at 3 categories: students, staff, and the community as a whole. in comparing them, we can get a sense of the risk posed by attending school.
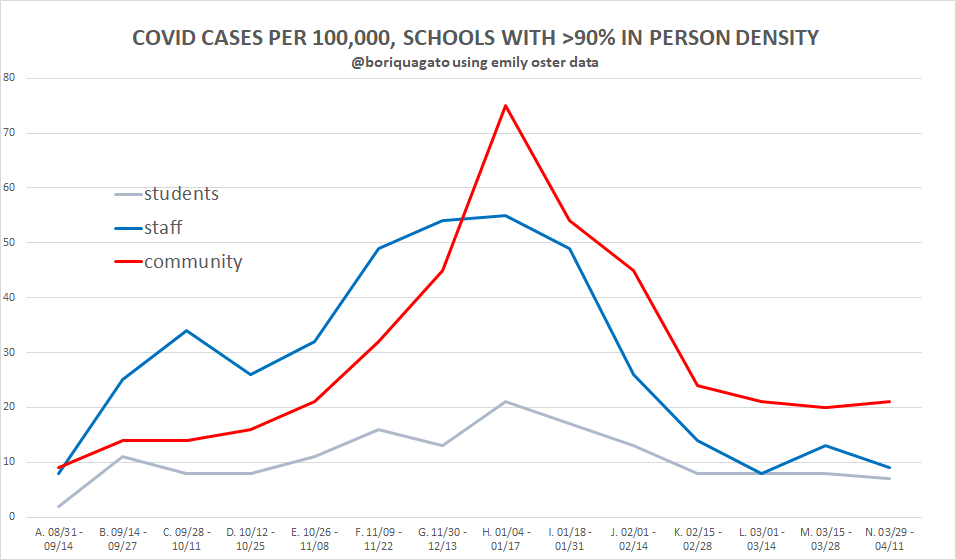
let’s start with >90% in school to give us a sense of how “being in school” worked out.
we see several things here:
incidence in schools generally tracked incidence in community
incidence levels were low overall and peaked for staff at 55 per 100k per 2 week period = 0.05% = 1 in 1,818 per 2 weeks meaning many schools likely saw none at all in any given 2 week period even at peak.
students got very little covid relative to community. this is not surprising. such outcomes have been well documented.
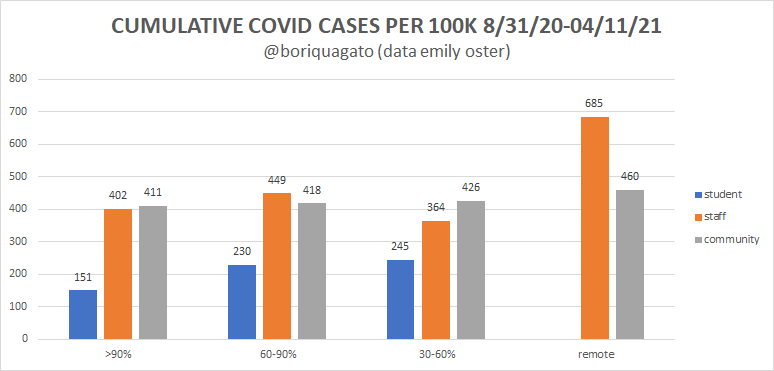
staff got more covid cases early, fewer covid cases later, and slightly fewer overall. (402 cumulative cases per 100k vs 411 community). two possible causes seem likely:
staff were more exposed early, caught covid earlier, and then developed immunity (or got vaccinated).
staff simply got tested a lot more than the community last year and that they show a high case count because they had a higher sample rate.
these are not mutually exclusive. assessing this would require knowledge of community and staff testing rates. this is data i do not possess. (if anyone does, please reach out. i would be very interested to see it)
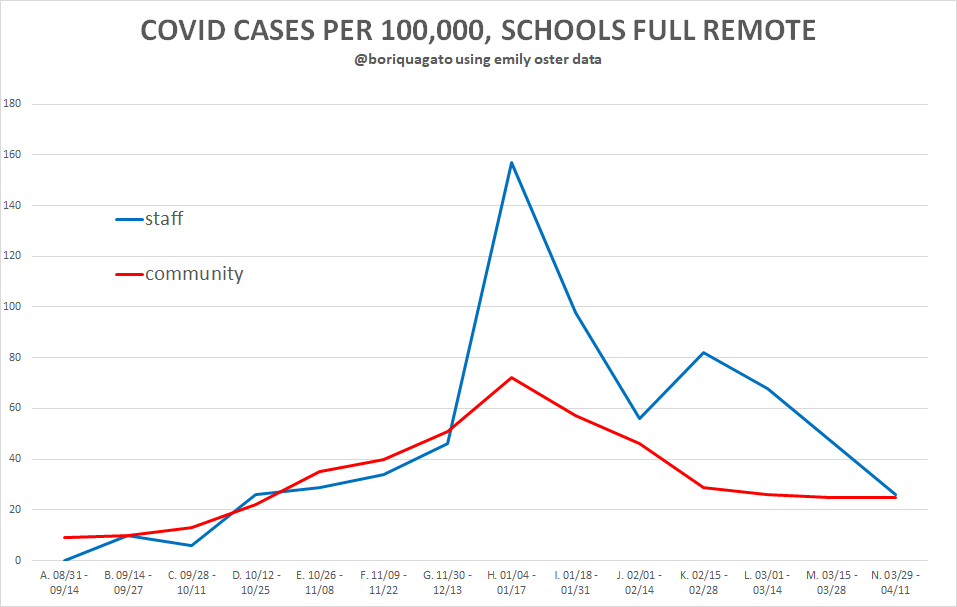
we can then compare this to entirely remote schools, where, unfortunately, student infection rates are not available.
incidence in staff tracked community until mid december, then shot FAR above it leading to much higher incidence overall (685 vs 460 cumulative) cases for 100k. this is an extremely strong divergence though determining if this was more testing or more susceptibility is, as above, not definitively possible.
that said, it’s not immediately clear to me why stay at home teachers would be getting tested at unusually high rates vs community or vs teachers who are in person and thus tested quite a lot as part of in school protocols.
something is going on here. these numbers for staff are MUCH higher than in open schools (peak 157 vs 55 per 100k) and are 70% higher in aggregate cases. it diverges from all other series by similar or even wider margins.
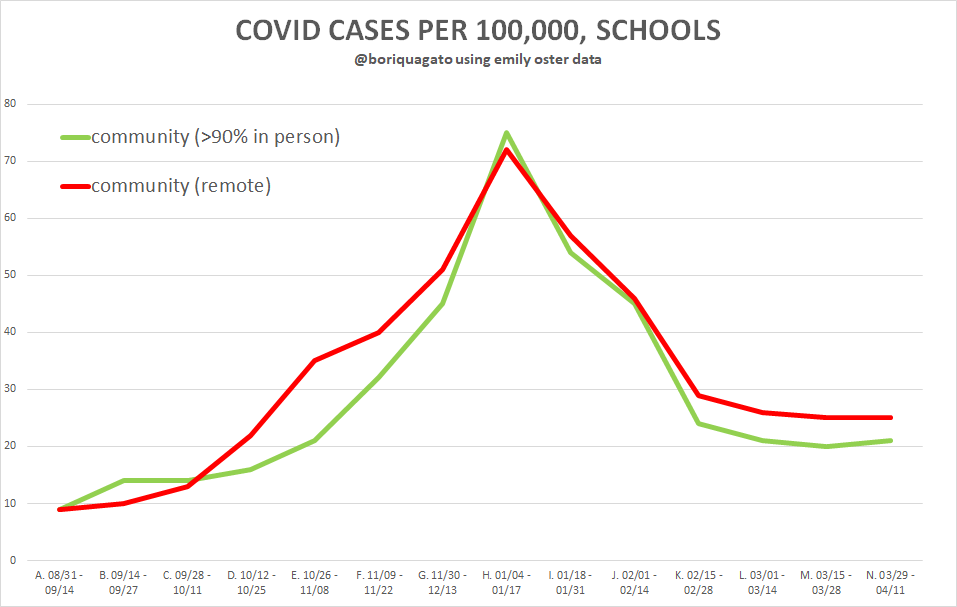
one might argue (and many have) that this is selection bias where the worst hit communities kept schools closed. however, i am not finding that especially persuasive. if this were so, one would expect to see strong variance in community rates as well. but we do not. community infection rates in “all remote school” areas was very slightly higher overall but actually peaked very slightly lower.
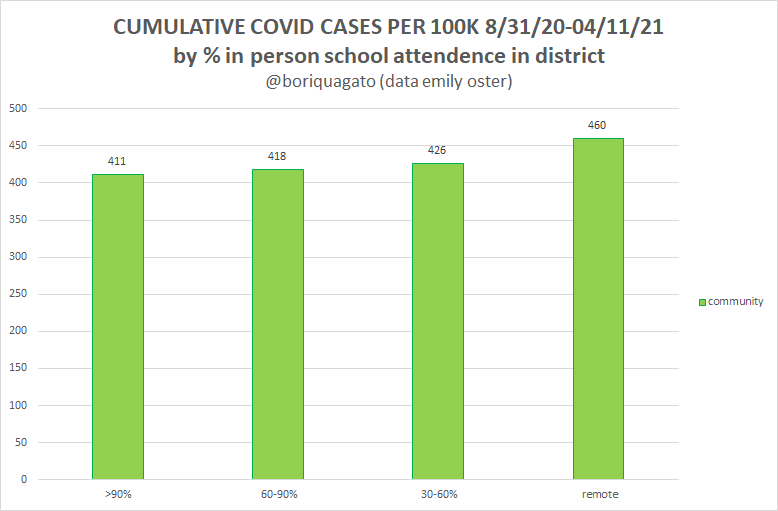
we see the same issue in cumulative community rates across all subgroups (plotted here as area under curve is notoriously difficult to eyeball) there is a slight relationship between community case rate and school closure, but it’s really pretty minor.
over 7.5 months, the variance in staff infection rate is0.41% vs 0.46%.
one twentieth of 1% overall differential rate does not seem like the kind of factor that drives a difference like “schools are open vs schools are totally closed.”
it looks to me like community infection rate is unlikely to have been the major driver of school policy. this data makes it look like a pretext, not a cause.
we can see all the aggregate series here. clearly, the big outlier is the high staff case rate in “all remote” education regions
student case rates are lowest for full in person, basically the same for the 2 middle cohorts, and, unfortunately, not available for remote.
whether the full in person drop in kid rates means anything is anyone’s guess, but honestly, i suspect it does not. it’s likely an artifact of schools in areas with less covid fear testing less as part of mandated school programs and generating cross correlation. this case data is hard to get too definitive with without being able to homogenize for sample rate.
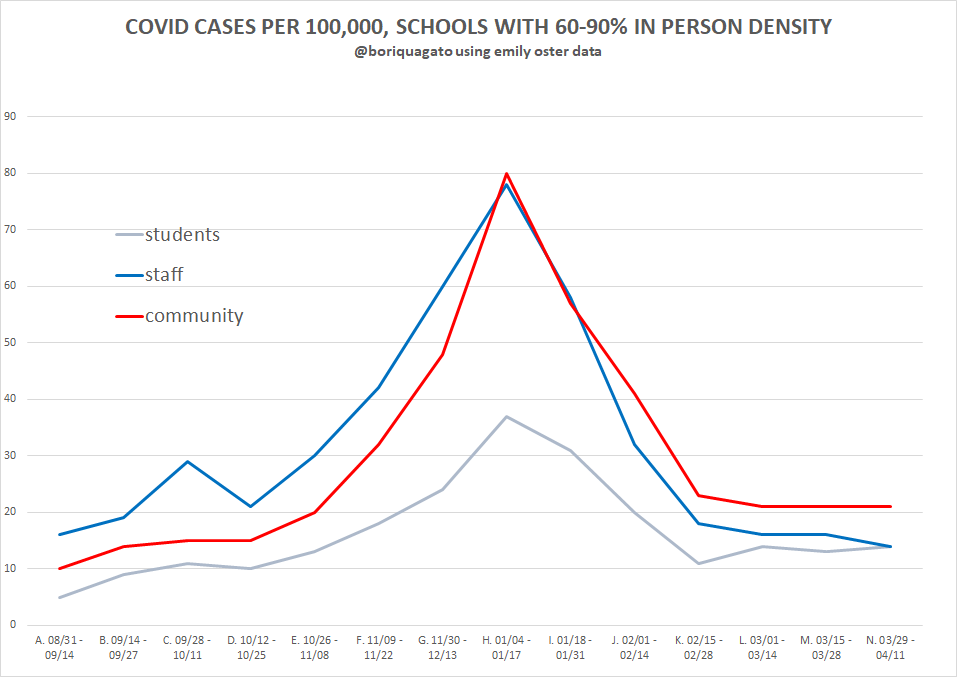
for completeness, here’s the rest of the data:
and
in both cases, staff and community rates look very similar in terms of curves and aggregates. there’s just no material difference.
takeaways
open schools appear very low risk for students and staff
greater in person schooling is not associated with greater infection rates for students or school workers and may be associated with reduced rates overall
community infection rates vary little and seem insufficient to be the likely driver of such dramatic variance in policy choice
teachers fared worse by far in places with full remote learning. this result is a striking outlier and i lack a great explanation given how widely it diverges from community infection. this warrants further work.
this all leads to and supports the conclusion that schools should be open.
their closure harms children socially and educationally and this harm is most acute among the most vulnerable who have less access to environments conducive (or even capable) of distance learning and whose home-lives are less stable. it increases food insecurity and puts stress on parents, many of whom are having to forgo work to provide care. this policy has been a DISASTER and is taking a huge toll on MENTAL HEALTH.
it does not appear to be buying anything. this is political science, not bio-science.
there was never a strong case to close schools, none of the standing pandemic guidelines prior to 2020 recommended it, and no data has since emerged to change that fact. claims of CHILD VARIANTS that are suddenly affecting kids are easy to debunk. this is just statistical sample salting by upping the testing rate heavily on kids the minute they set foot in schools and then using that data to try to claim schools were dangerous. it’s just circular reasoning that creates a feedback loop to CLOSE SCHOOLS FOREVER. it all maps so closely to “strength of teachers unions” that i doubt one need even consider another variable to predict nearly all outcomes (more on this soon)
this has been a travesty of regulatory capture driven cronyism and self-dealing. there is no sound epidemiological reason to have closed schools and the the evidence they should all be re-opened immediately looks strong.
we’re being sold a bill of goods at the expense of our children. this is not science, it superstition. its not safety, it’s focused harm.
<gets on soapbox>
come on guys, we're supposed to be the adults in this room, not the panicky wet pants children imposing our atavistic fears and febrile night terrors onto others.
this is a failure of our duty as adults, as parents, and as humans.
do you really want to tell these kids that you sacrificed their educations because you were too afraid to think clearly and too lazy to do the actual cost benefit?
food for thought.




You are beating them at their own Single-Metric approach to Covid. Well done.
But public health and individual health are more than just one metric. Physical Health, Emotional Health, and many areas of Development have been damaged by 13 months of closures, blame and shame.
Never a cost-benefit analysis. Always focusing on the Boomers over Gen Z.
This was easy. This was a layup.
Fabulous analysis as always. Out of the many, many evils deliberately done through these insane lockdowns, the harm done to children and care home residents (still being treated worse in the UK than prison inmates) are immeasurable and truly wicked.