
israel has been playing an interesting role as a bit of a canary in the coal mine. they have been pushing vaccines, vaccine passports, and now boosters harder than just about anyplace else on earth.
they also make a good lab as they report solid (by covid standards) data and occupy only one regional climate zone so we do not need to adjust for heterogeneous seasonal surges within the aggregate (as we do in the US).
and one thing is becoming very clear:
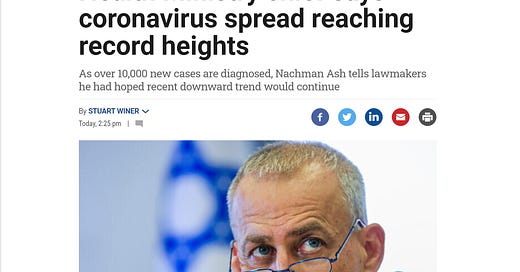
whatever they are doing is not working and even their health ministers are having to admit this.
this dip was (as i expected) driven by a drop in testing and reporting due to rosh hashanah (and will likely dip again late this week for yom kippur) but next week, we should be starting to get clearer data again.
with over 30% of the total population now having had a booster shot since the commencement of that program in earnest on august 1st, we should be able to get a sense of efficacy.
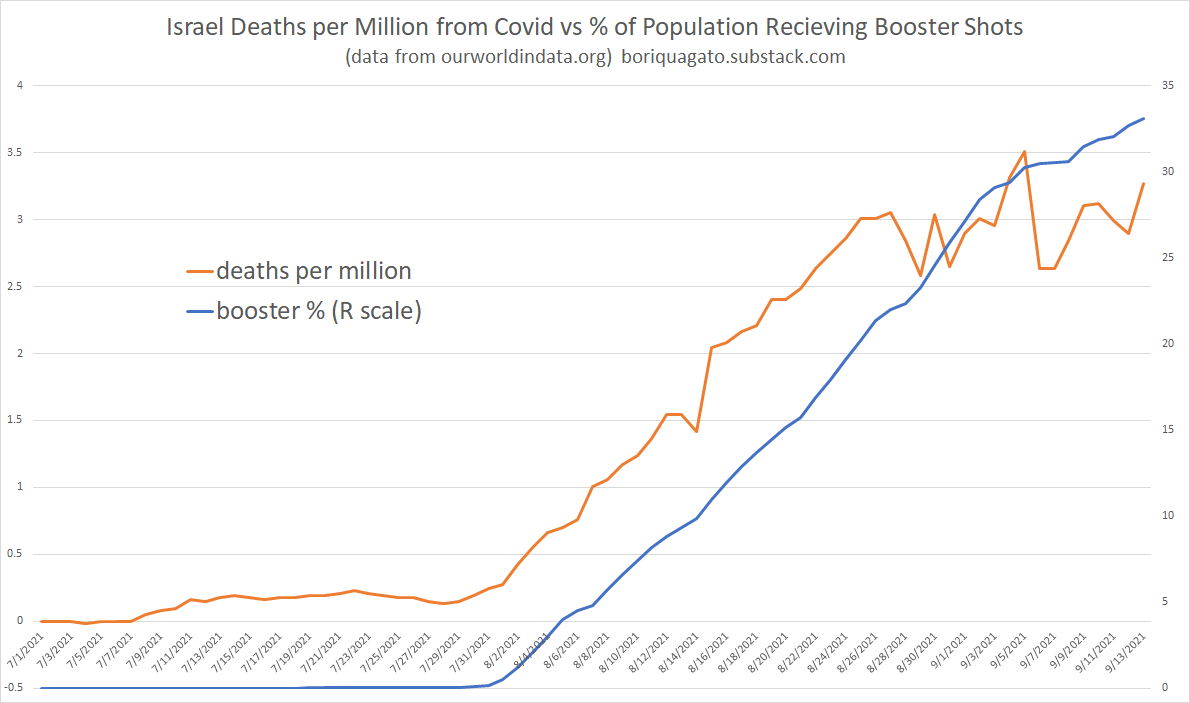
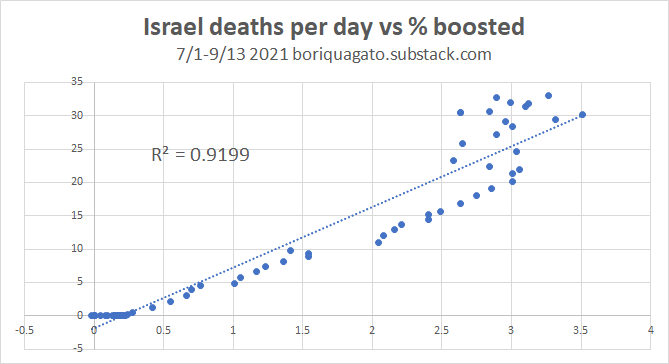
i ran the series of booster uptake and plotted it vs deaths per day. what i saw looked like cause for concern and appears to validate calls from the departing FDA vaccine experts to get a good, hard look at this data before doing anything aggressive.
boosters began to rise and by the time they hit even 0.5%, deaths were starting to rise with them. the two move in near perfect lockstep. clearly, correlation is not proof of causality, but this is an awful lot of signal to ignore out of hand especially given our strong reasons to presume causal linkage. (that said, the alignment with seasonal surge poses difficulties in separating signal source)
it’s further worrying that even with a 67% vaccination rate at the beginning of this rise and a significant portion of the population having already had exposure to covid AND cohorts of the highest risk already having been depleted in past waves, that we are seeing such a strong surge in deaths from a delta variant that looks to have a much lower CFR than prior variants. (0.4% vs 1.1% per UK variants of concern data)
it has barely attenuated at all (and it’s not clear we’ve reached highs. consider the “false flat” from last year and how much later this surge was this year. we could be at the half way mark. this will bear watching.) may 15-july 31 is highlighted in both years.
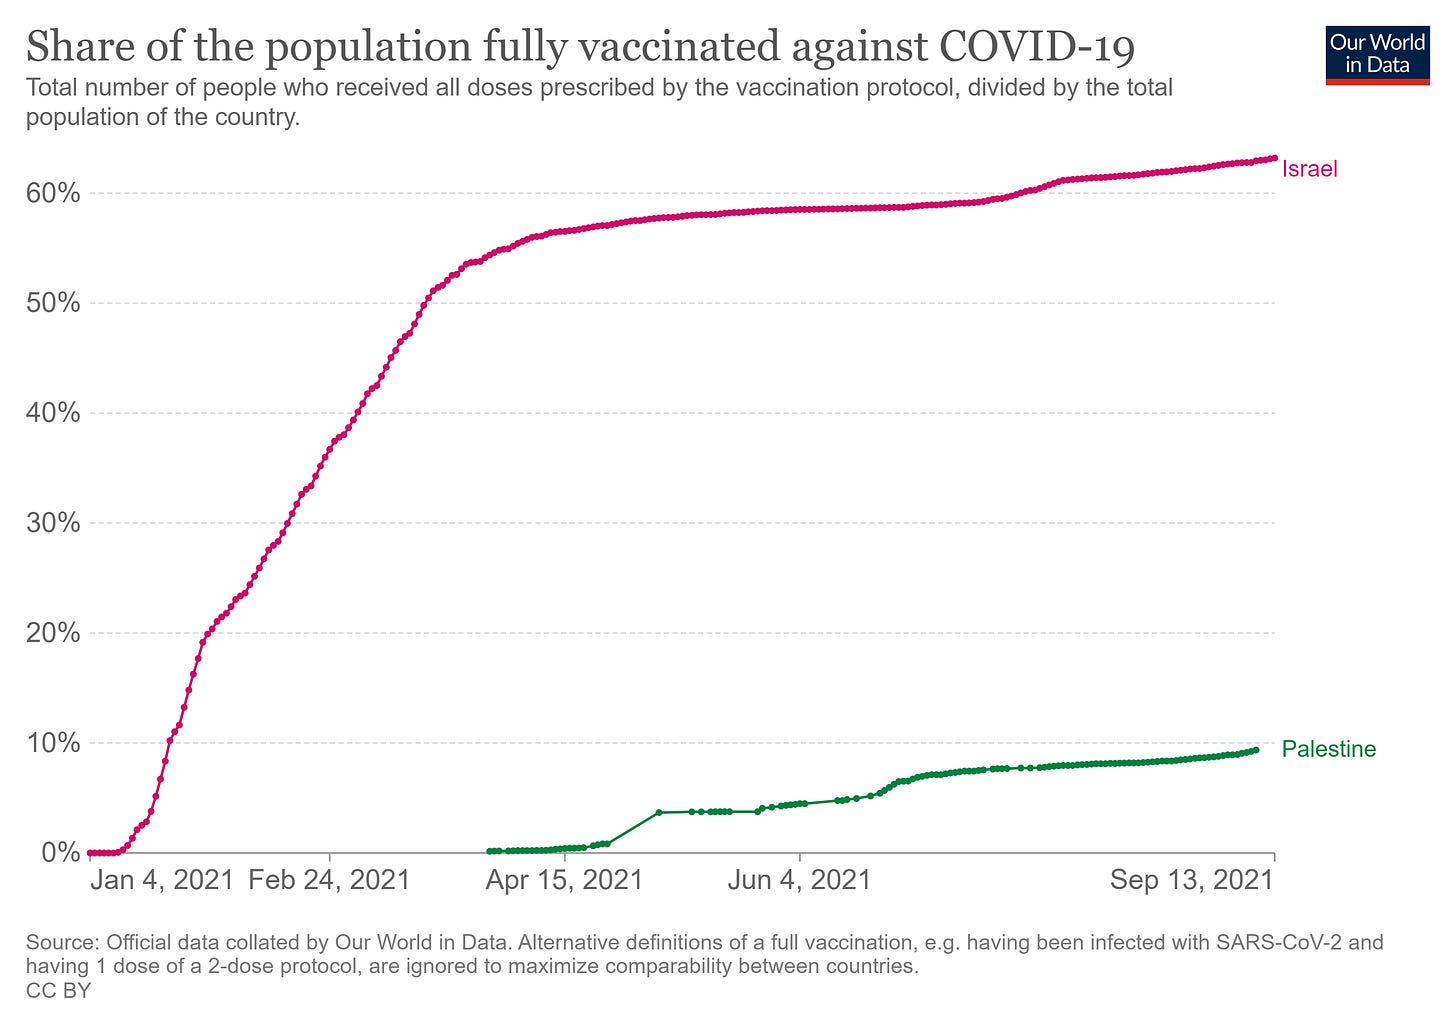
we also see very little differentiation from immediate neighbor (and low vaccine rate control group) palestine who, for whatever reason, seems to lag israel by about 3 weeks on surges.
(this, it could be argued, shows that the boosters are not causing the surge. OTOH, if we accept that then it also follows that a high vaxx rate and the boosters are not stopping deaths in any visible manner either.)
this huge divergence:
leads to this close mirroring. this is not a strong endorsement for the overall societal efficacy of vaccines in preventing covid death.
we’ve seen signals of vaccine driven death increases before with initial vaccinations, just not this instantly. in other places and in the first round you tended to see a 21ish day lag, pretty much what you would expect if cases spiked and then deaths followed as deaths tend to lag infections by about 3 weeks.
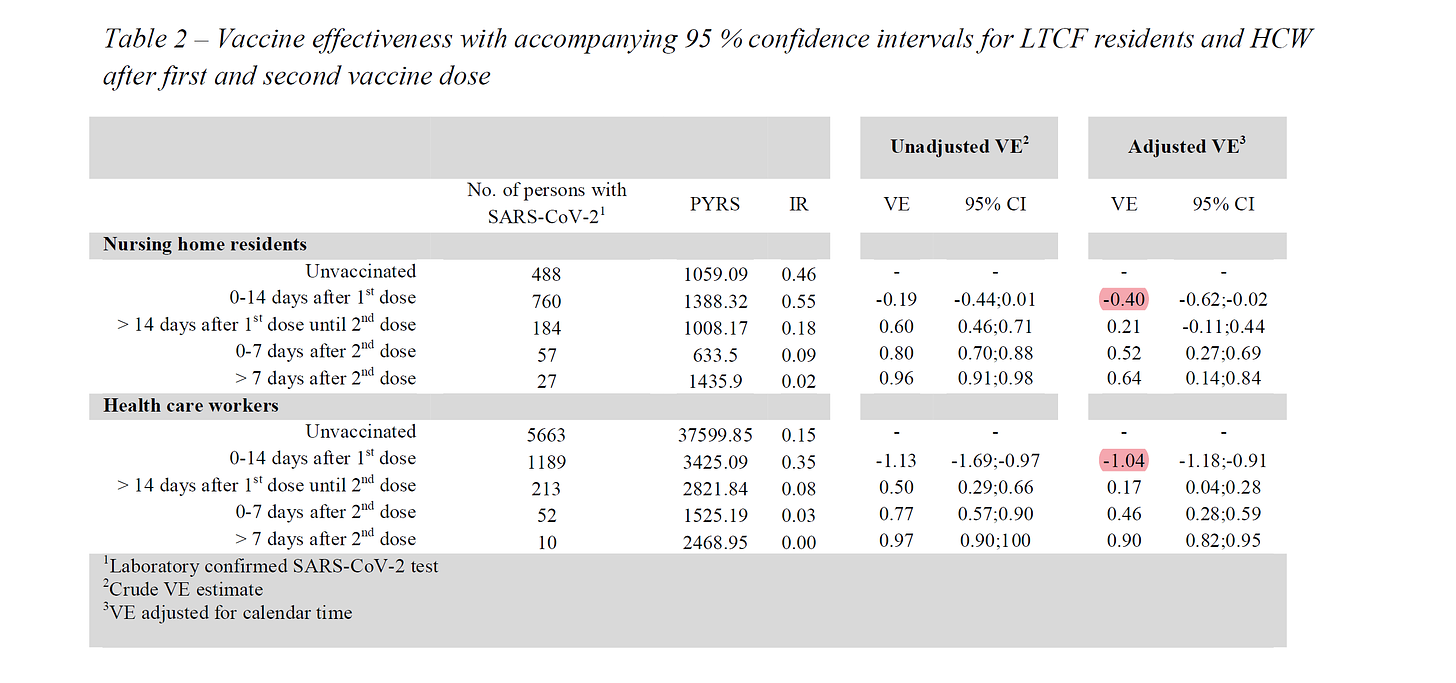
and we already had strong reason to suspect that those who were just vaccinated were showing negative vaccine efficacy early on. DANISH shown here, but similar results have appeared in several others and appears robust.
this is why i find it so disingenuous to only measure vaccine efficacy from 7 or 14 days post dose 2. it’s like claiming that you’ll be safe if you run to the bunker, but ignoring that you must cross a minefield strafed with enemy fire to get there.
there is currently A LOT of discussion on issues from these doses causing neutropenia (low white cells) to some kind of TLR shutdown (preventing innate immune recognition and response) mediated by the modification of uridine in mRNA vaccines to prevent your immune system from destroying the vaxx before it gets into your cells. the mechanism still seems to be a matter of debate, but the signal of immune suppression looks strong.
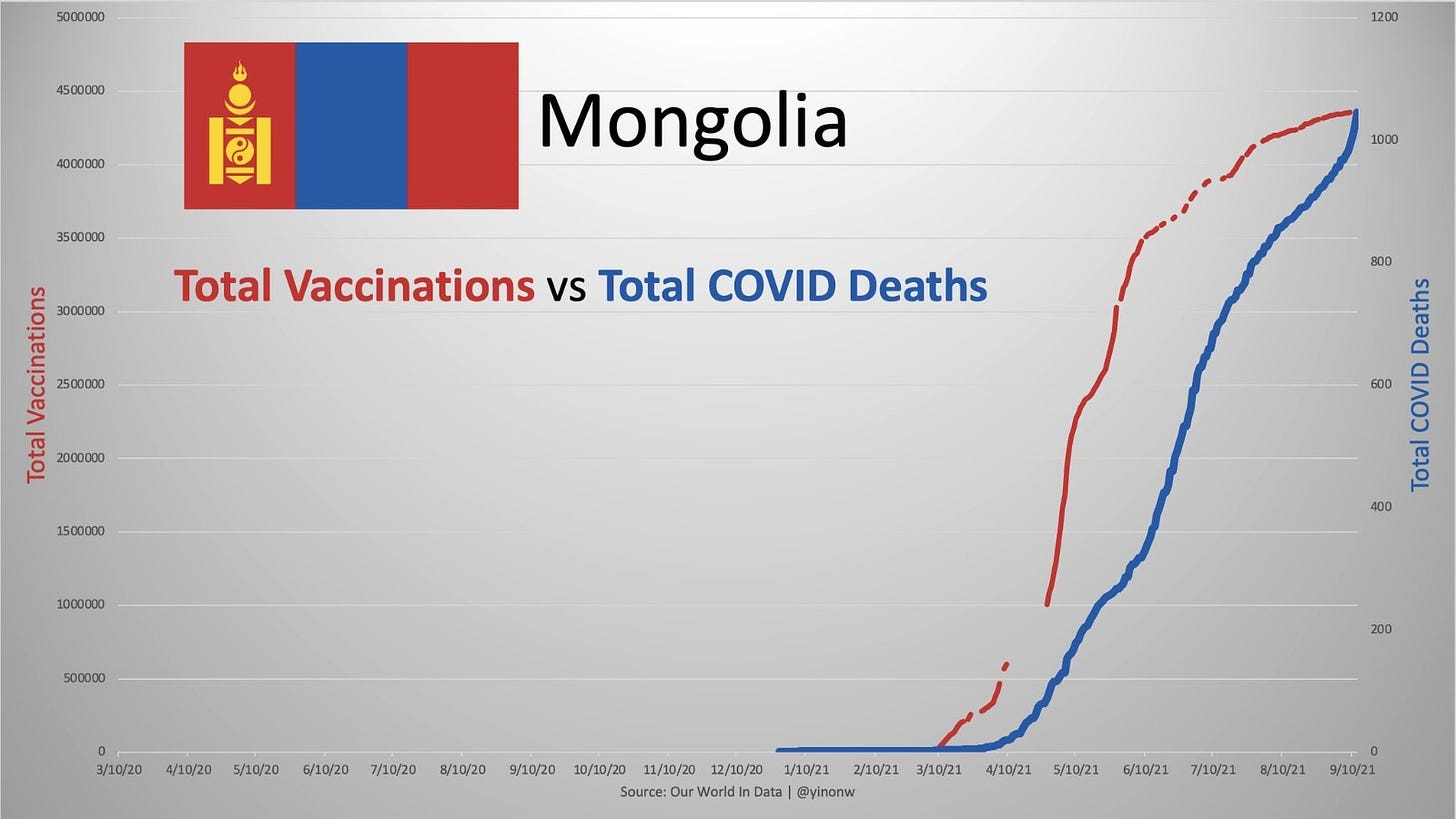
and we’re seeing an increasing amount of societal scale data to back it up. we saw it in mongolia and we’re now seeing it (with far less lag) on israeli boosters. this could be a false alignment and just seasonal signal, but wow are the correlations tight.
(and yes, i understand the autocorrelation issues with %’s here and the caveats on data mining, but given
the a priori reason to suspect causal relationship
the fact that both went from flat to hockey stick trend at the same moment
the fact that when we shorten timeframe to meet biological expectation we see a near log RISE in R2
i’m inclined to be undeterred by that risk. there is a lot of reason to presume that this correlation could be neither spurious nor a data artifact.
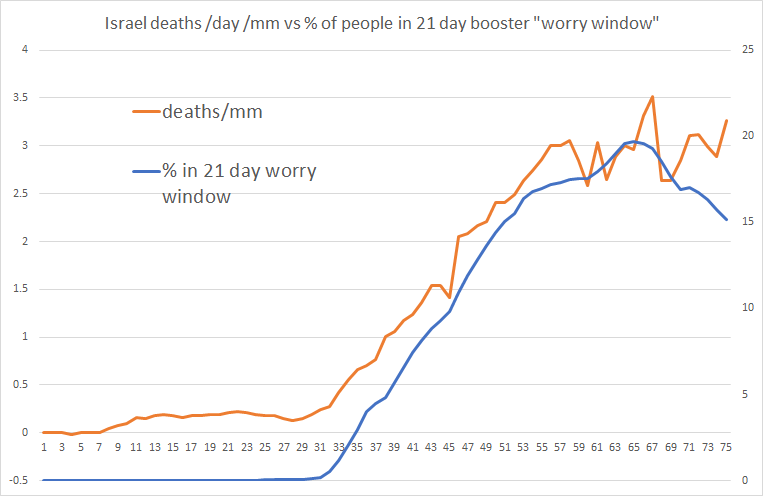
and the other interesting feature of this data is that about 25 days post the commencement of the booster program, right about when vaccines are known to be reaching efficacy rates, the deaths stopped climbing. (note this is right when all the vaccine studies are measuring VE and people are called “fully vaccinated.”
given the slope of the booster line, this makes a provocative sort of sense as after about 8/25 we’d expect to see about the same number of people falling out of the 21 day “worry window” as entering it.
if we take the % in their 21 day window post booster (more or less consistent with the time to remodel TLR receptors etc which is provocative) this shows up pretty clearly.
deaths flatten out right as WW cohort size flattens. i’m not sure how much of the apparent drop from the last few days is real or data delay around holidays, but presuming it’s real, we might expect deaths to attenuate soon if boosters have been the key driver. another thing that bears watching.
interestingly, this correlation tightens when we shrink the interval to 14 days (the period that showed negative rather than merely reduced VE in the danish study) though the recent divergence is also greater. (both charts are 7/1 to 9/13)
all the usual caveats apply here. this is a work in progress, messy society level data, seasonal signal muddled in and a pile of other possible confounds. it may well be that this is not being driven by boosters and rather by seasonality, but if this is so, it does lead to some pointed questions about “so what did all this vaccination, boosting, and vaxxpass actually get us?”
if we’re going to be “the side of science” we have to be very careful with data like this. let’s not run off half cocked and make claims we cannot yet support.
on the other hand, the existence of data like this and its possible poignance is EXACTLY why we need to be performing analyses BEFORE we institute mass programs to inject people full of vaccines with incredibly short longitudinal data periods and boosters with basically none.
you do the work first, then you make policy. doing the reverse is grabbing the first object you see and jumping out of a plane hoping you can figure out it’s a parachute on the way down. and we’ve certainly had about enough of that in the last 18 months…
israel may provide a very useful canary in the covid mine for the US as they are adopting policies we have been considering and i think we really need to pay quite close attention as this does NOT look like a healthy birdie at the moment.
so let’s keep studying it.








Gato, I posted this is another thread, however it would be great to have someone so facile with data to look and and comment on the CDC "Study" the administration is using to prove their case for "pandemic of the unvaccinated".
https://www.cdc.gov/mmwr/volumes/70/wr/mm7037e1.htm?
In particular, they keep at the "11X more likely to die" as if it were gospel. It's a great Tweet-bite, but I don't think the study allows them to say this with any confidence. What say you, or anyone else who'd like to chime in?
It’s not a dead Israeli canary. It’s just resting