
swedish birth rate data: what does it really show us?
digging in to see if this drop is truly unusual
there has been a great deal of talk about swedish birth rate data (among many other countries) in 2022.
i think sweden provides a particularly interesting lab/test case for a number of reasons:
they provide good data
it goes back 25 years
they did not engage in much lockdown so that is not a confounding factor to the extent it is in most of the rest of the west
there seem to be two competing lines of argument:
some are pointing to precipitous drops in recent months and claiming this is a highly unusual outcome.
others are claiming this is no big deal and that there is always variability like this.
as ever, the one way to find out is to roll up your sleeves and dig some data.
so here we go:
i took THIS SERIES from the swedish statistical agency and worked with it. it has data by month back through 2019 and per year back to 1998.
to eliminate the effects of population growth i took all live births data and divided by population to get births per million population. all data is presented that way.
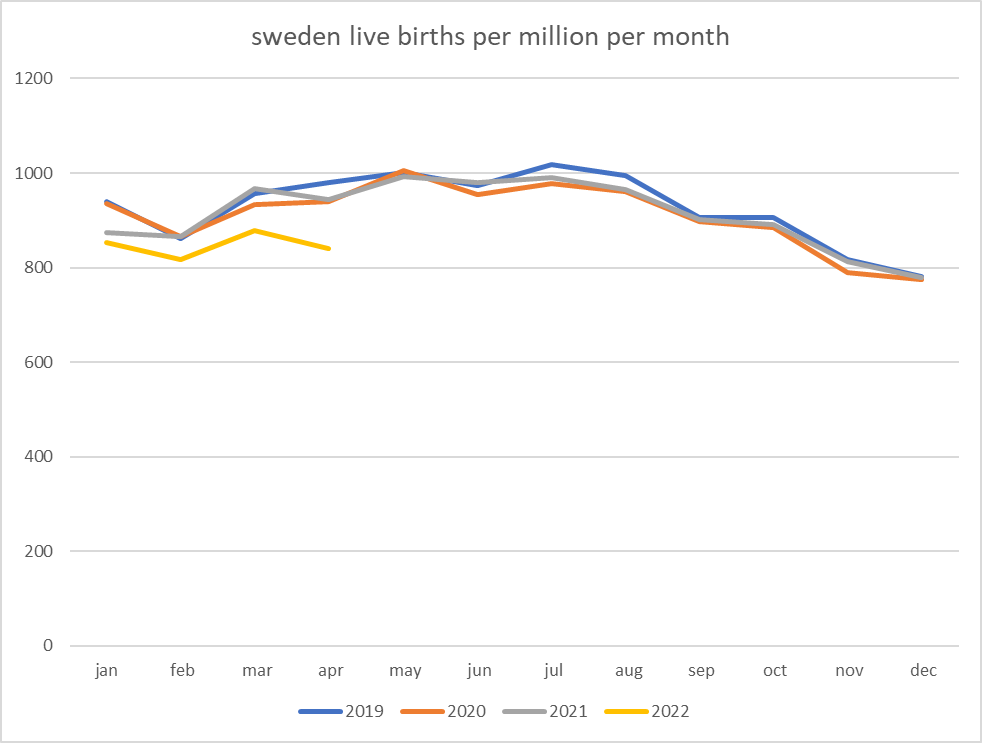
i like to start with raw data in full series to get a sense of what one is looking at. so this is all data per month from 2019-april 2022.
from the look of this chart, nothing terribly unusual is going on. this seems to be a key aspect of the “normal variability” argument.
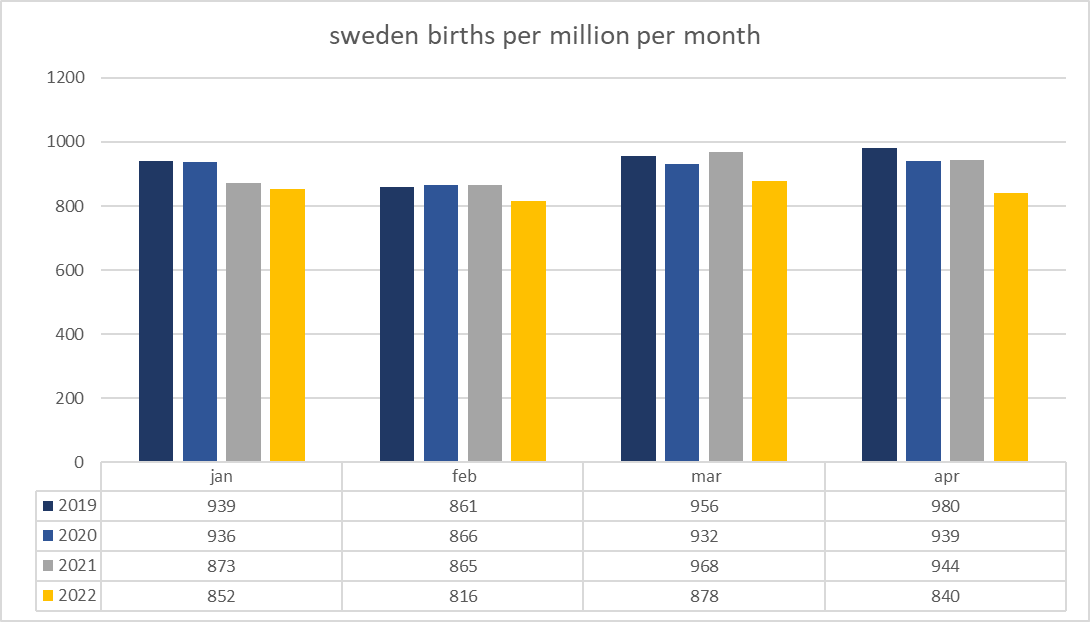
but i think this is extremely misleading and those using it to say so are getting it wrong. here’s why: the signal is highly seasonal, and when you line it up that way, 2022 really pops.
you can see this another way here:
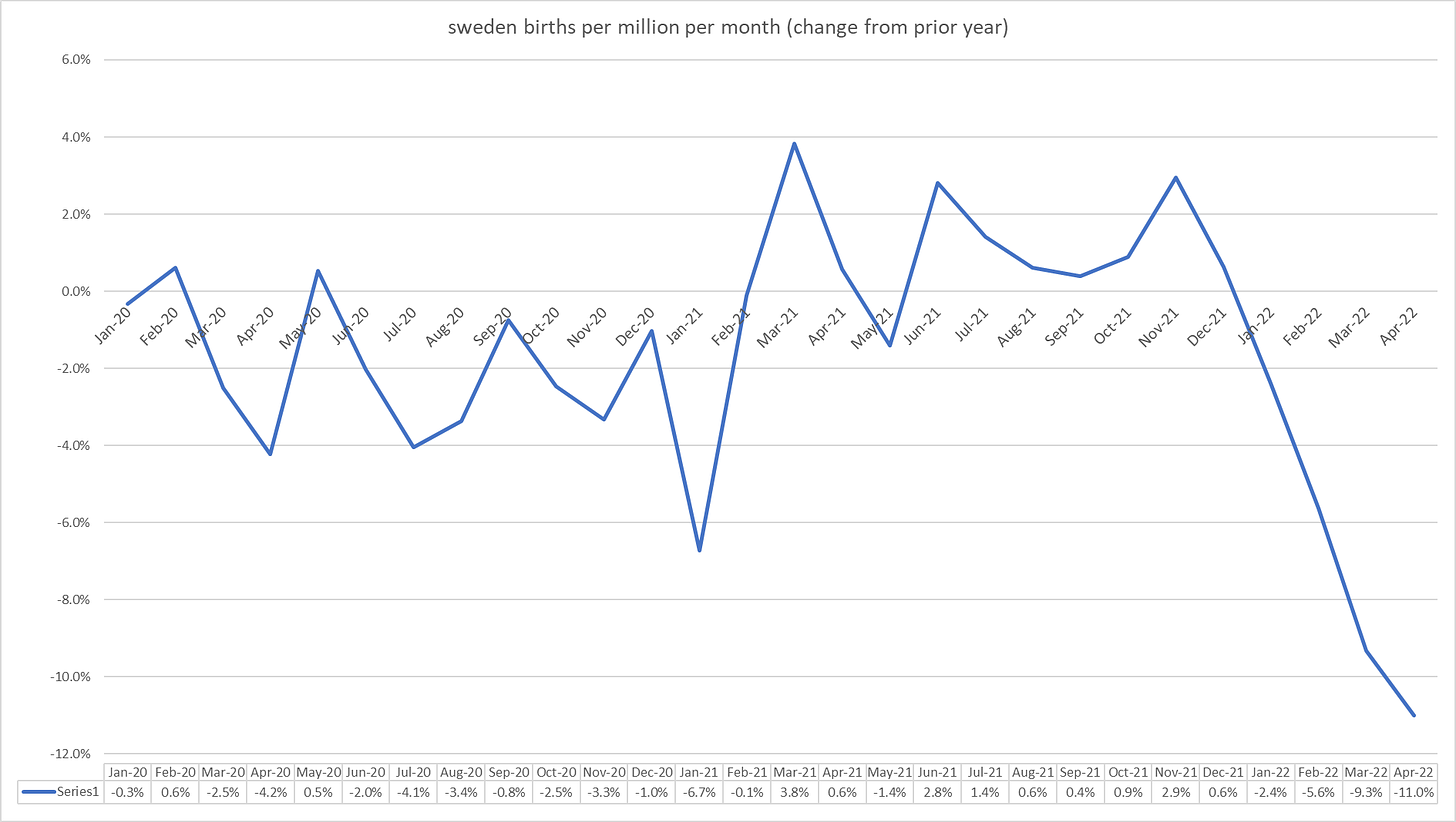
2022 really is quite a lot lower. and if we look at this as % change from prior year, you can really see the delta.
birth rates are collapsing far in excess of normal or any prior point and this rate of decline is accelerating.
of course, one can also argue that this is a very short time period and thus perhaps not terribly meaningful. i think this is a fair criticism.
so let’s zoom out:
the data is only available by year (not month) pre 2019 (though if someone knows where to find monthly, i’d LOVE to see it)
i looked at the data from 2019, 2020, 2021 and noticed something interesting:
the % of births in jan-apr relative to the year as a whole was remarkably constant.
it was 33.6%, 33.7%, and 33.3% respectively.
that’s a very tight range, tight enough to make what felt like meaningful extrapolation.
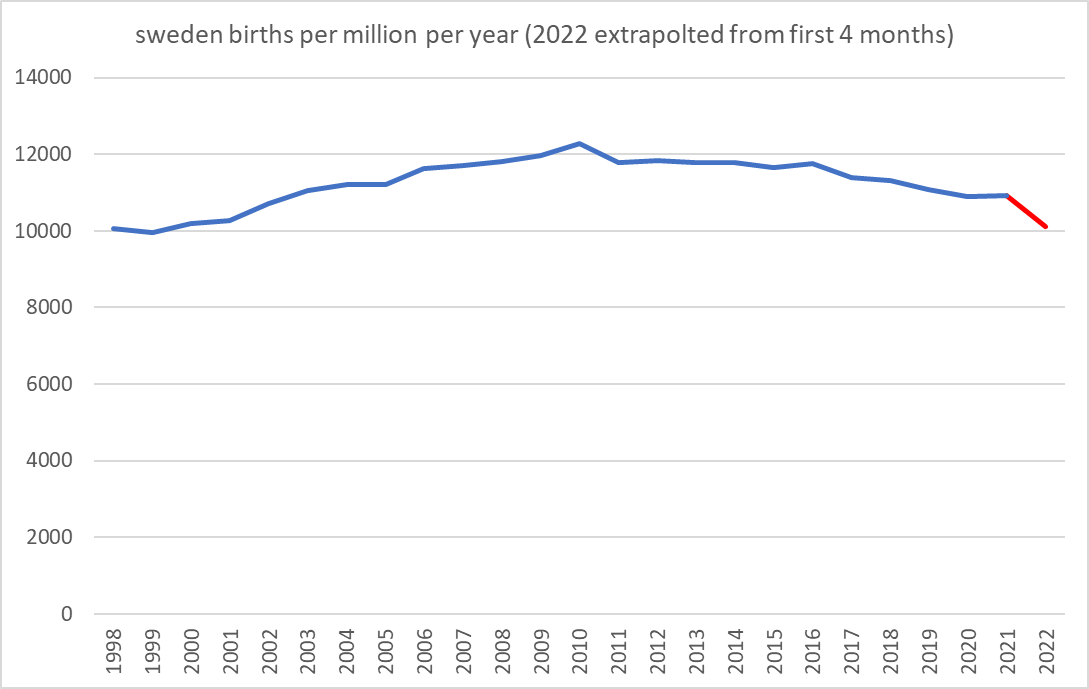
so, i took their avg (33.5%) and used it to predict 2022’s full value.
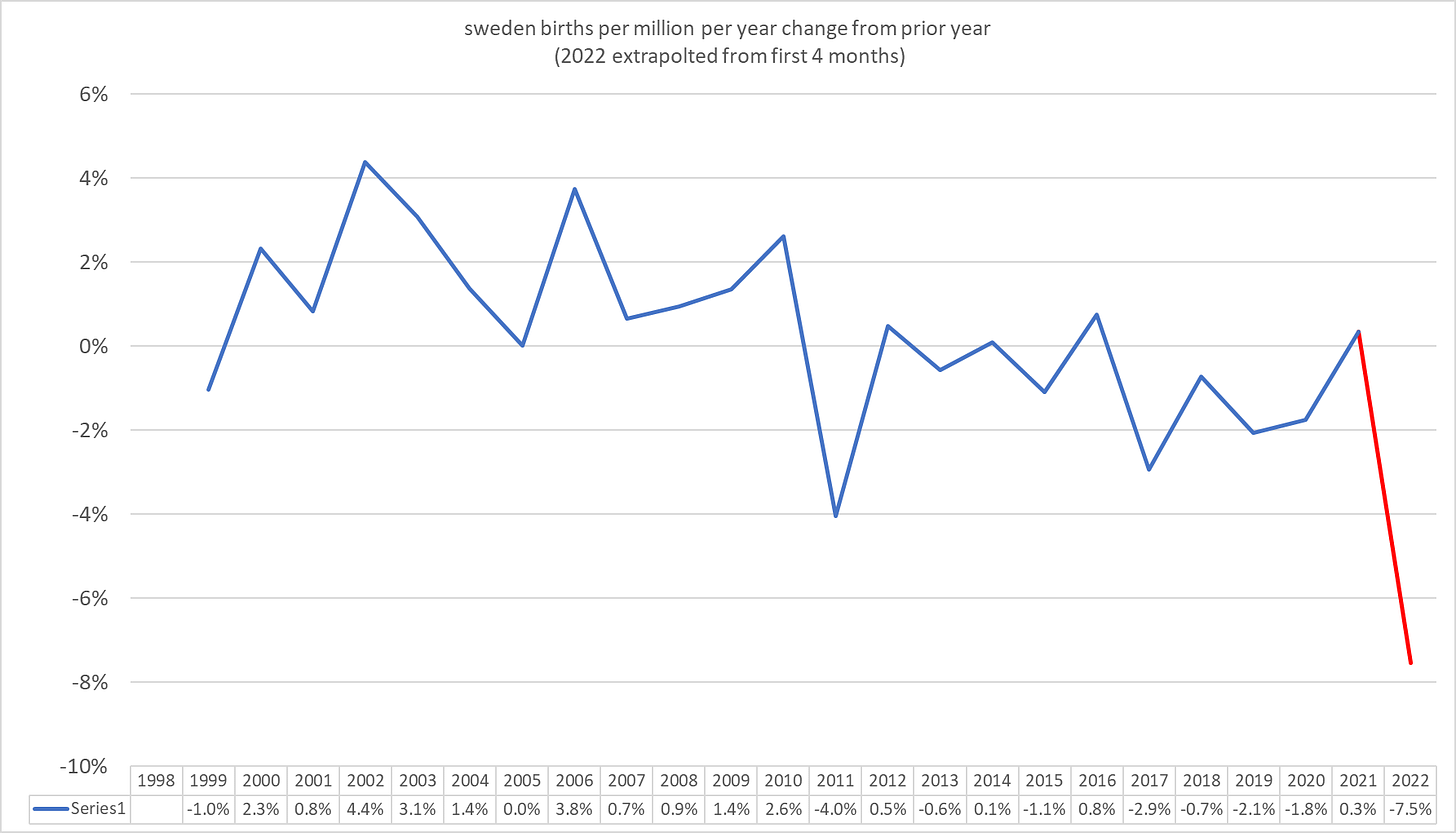
i marked it in red on the graphs to ensure that people realize it’s an estimate.
this is a BIG move.
it’s easier to see when looked at as % change from prior year.
there has been nothing like this in the last 25 years.
the next biggest drop was barely half this size and that was a significant outlier too.
we’re on the order of 2X the divergence of the biggest previous outlier in 25 years at -7.5% in a system where being under -2% is a sub 10% occurrence.
so, unless this jan-apr ratio changed wildly in a manner not seen in recent years, we’re looking at something pretty extreme.
based on what i’m seeing here, the birth rate drop is quite real and quite unusual.
it starts in earnest in jan 2022. that means babies that were conceived in april 2021. it’s accelerating into april (babies conceived in july 2021).
and look what was going on then that had never happened in sweden before:
correlation does not prove causality, but this kind of fit when we already have an a priori reason to suspect fertility impact from completely independent biological testing is more than a little provocative.
discussion here:
whether or not this reverses is an interesting question.
it looked to me like 20-40% of those jabbed saw near total suppression even at ~6 months. this would imply that we are nowhere near peak fertility decline (but also may be very hard to map to society scale).
so if this is vaxx driven, it’s likely to persist all through 2022 at the very least.
the effect is large and unprecedented in the data for 25 years as far as i can see (though admittedly, having a full 25 year series by month would provide more clarity)
the alignment on hypothesized cause and effect is extremely precise.
and we have a priori reason to suspect the relationship based on hard biological science.
all in all, i think this makes the case that sweden is just experiencing normal variability look very weak and the the case for a vaccine driven effect look quite strong.
that is NOT what i was hoping to find. if this is what it looks like, this is very bad news.
but the thing about data is you have to follow it where it leads.
otherwise you’re just making stuff up.
will keep on this. seems like very important issue to get to the bottom of.




Thank you for doing this. This is exactly the type of detailed analysis I was looking for. I've been tracking the birth numbers in Scotland. Their picture is not yet quite as clear.
I've written an open letter to Gov. DeSantis, asking that he mine his statewide vaccine registry to compare health outcomes in vaxxed vs. unvaxxed. He could compare birth rates, too. The feds have all this data but will continue to bury it. Meanwhile, all it takes is one courageous governor to blow this thing wide open.
My letter is here:
https://darbyshaw.substack.com/p/an-open-letter-to-gov-desantis-re
I'm putting $20 on stories within the next 6-9 months about how covid or "long covid" are negatively affecting birth rates.