as the US summer surge continues, the effects of delta and vaccination continue to be hotly debated. i have, frankly, given up on even trying to uses cases as a metric. so many are just positive PCR tests without symptoms and testing level has bounced all over the place so badly that the error bars on cases seem to be swamping signal. it’s also not clear to me we really ought to care.
it’s clear vaccines are having almost no effect on “reported cases” but this seems more an issue with how cases are counted than anything else. even CDC data showed that 74% of “cases” in a massachusetts outbreak were in the fully vaccinated. cases are just not a meaningful metric anymore (presuming they ever were).
so let’s home in on hospitalization and on deaths, which are somewhat more reliable (though hospitalized has some serious issues yoy as well)
the key question really seems to be “are we reaching some level of real community immunity? this data can help us get a sense.
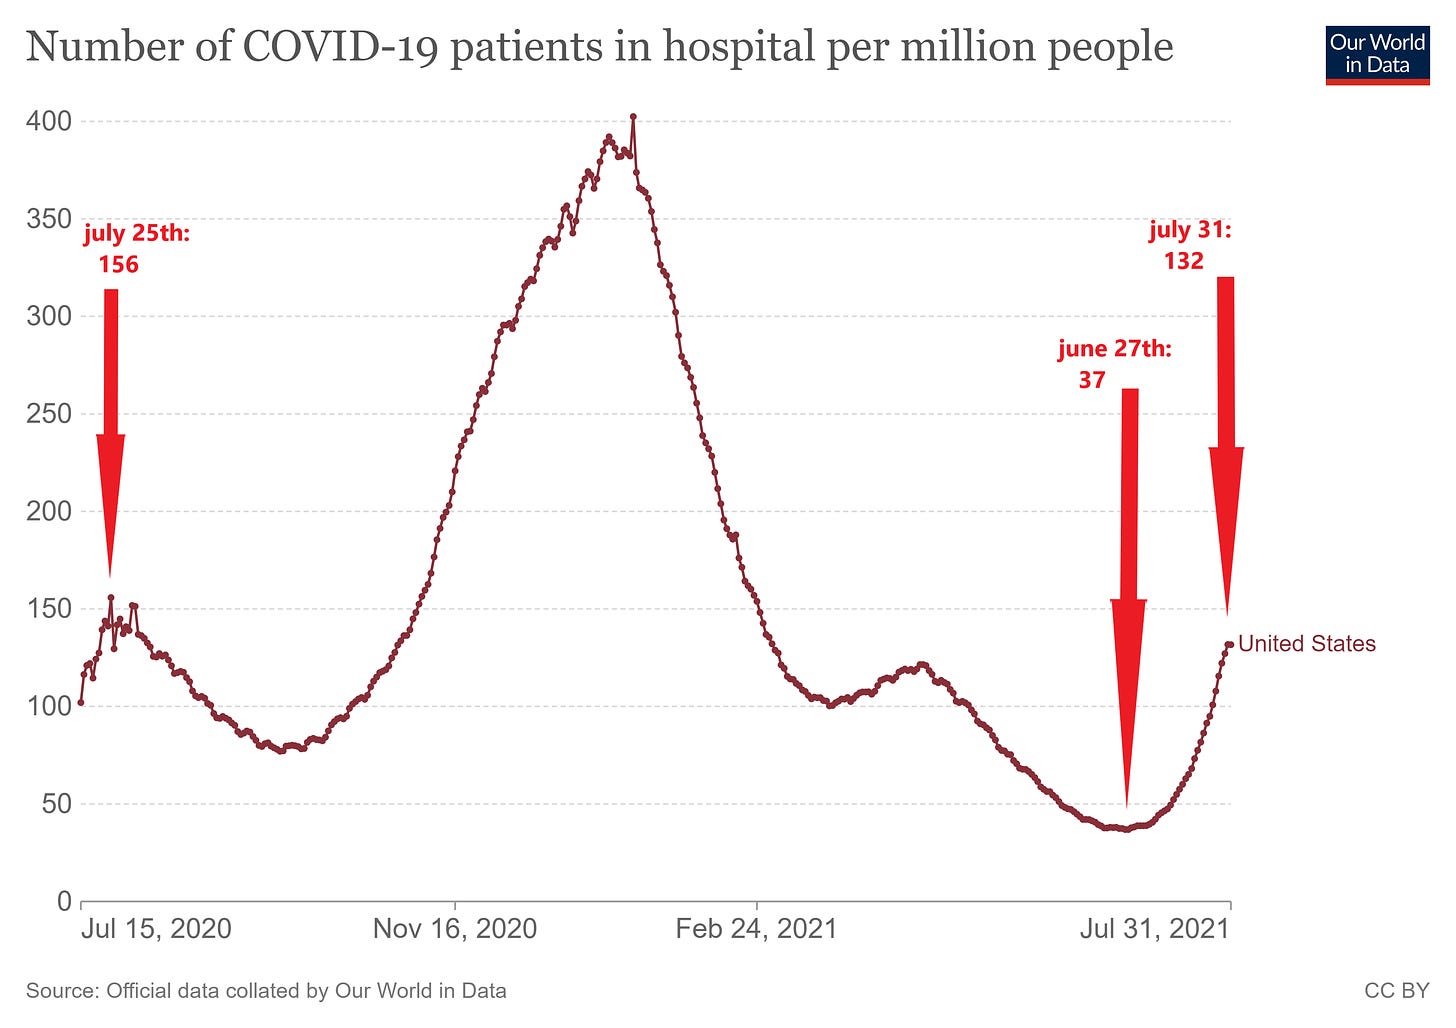
hospitalization:
this series does not go back far enough to get the trough figures from 2020 spring, so we’re guessing a bit on that and cannot calculate the length of the rise or its magnitude, which is unfortunate, but the data is what it is.
last year peaked on july 25th at 156 per million.
we’re currently at 132 and seem to be rising, though as history shows, this metric tends to turn on a dime. it’s not unreasonable to presume we’re near a top, but one cannot claim this yet either. we’re going to have to wait and see.
this data would, on its face, seem to imply low (if any) generation of functional community immunity, but there are several reasons to be skeptical of such a claim.
foremost, an awful lot of people have had covid and recovered. that confers a lot of immunity.
second, a great many people have been vaccinated and while vaccines seem not to be working as well as claimed by idealized trials, they are working to some degree and this will be additive as well.
third, the US changed the definition of “hospitalized” and made it more inclusive. this will inflate this years figures vs last.


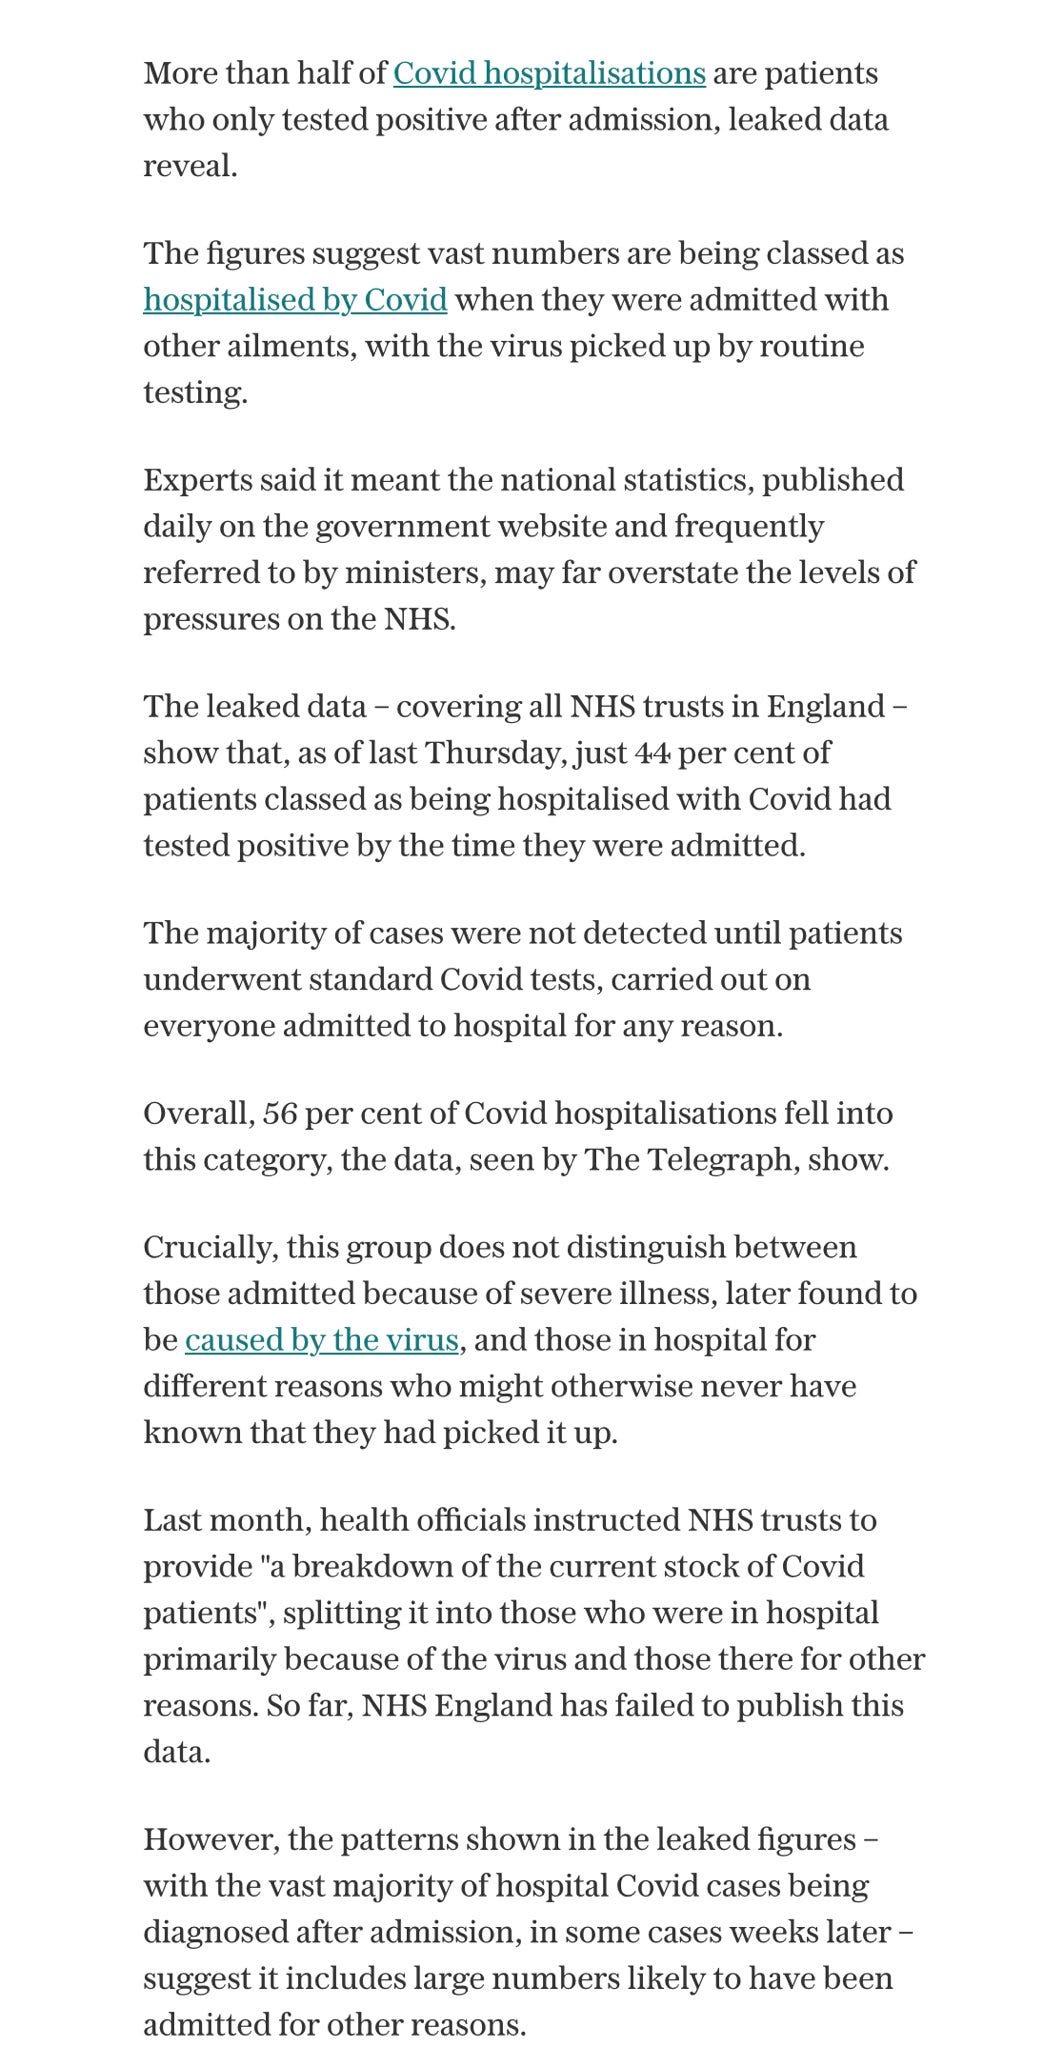
and finally, A LOT more hospitals are open in the US this year and this may be the biggest factor of all. last year, most we closed to elective procedures and people were avoiding them for any but the most serious of reasons. as hospital census rises, more people check in then test positive. this is either nosocomial infection (which has been rife) or trace virus contaminating swabs. in the UK, 50%+ of those called “hospitalized for covid” were not hospitalized for covid.
if anything like this pertains in the US (and there is every reason to so presume), this hospitalized number becomes all but impossible to read. we’re looking at error bars in the 60-70% range that are all weighted toward overstatement.
for this reason, i think we need a better metric. i am just not seeing any way to draw strong conclusions from the hospital data. garbage in, garbage out.
deaths:
this brings us to covid deaths. for all the issues with this series, these have generally been at least fairly consistent so even if we disapprove of the “death with” or “death near” covid vs “death from covid” methodology, we at least have a series that is comparable temporally.
it’s also a more complete data series.
in 2020
spring trough was july 6 at 1.58 per million
summer peak was august 1 at 3.43
in 2021
spring trough was july 5th at 0.65 per million (59% lower than 2020)
summer peak may not yet be established. current level is 1.24 (64% lower than 2020 peak)
this allows us to comp the deaths yoy as a % reduction from last year. we get this:
we’re seeing about 100% more attenuation (61% vs 31%) vs peak in may. that’s quite provocative and quite positive.
based on same day last year, we’re down 61% yoy. this is not as good as the 72% reduction from 7/27, but we’re starting to see some opposed seasonality as well as this peaked 2 days ago last year.
easy to see this here:
this does seem consistent with community immunity generation. a 60% drop is a big drop. seasonality seems a little offset so it’s probably better to wait until this season puts in a top before calling it a win, but historically, one would be expecting a top around now.
the math here is not hard, i suggest folks do some themselves.
the data is, however, of terrible quality, so i would caution against taking any one series as definitive sign of anything.
but no matter how you slice this, we’re WAY down from january and at least no worse than last year this time, likely much better. not even the perennial scare stories of “some little hospital in cactusbutt arizona ran out of beds!” are getting much traction. the data to refute the docs is too widespread now.
worry less.
live more.
there’s nothing terribly scary here at this point.
this data is far more supportive of “ending” than “gearing up to continue.”


I just watched Ron DeSantis' roundtable with Hospital CEOs. What is indicated above about Hospital admissions indeed seems to be the case-- one CEO said 80% of COVID Hospital admissions are individuals who came for something else and were later tested positive, but these are mostly asymptomatic people who have been vaccinated. He didn't even consider these COV hospital patients but they have to be reported as such. Hospital stays are also very short for vaxed 1 to 2 days, longer for unvaxed. Those treated with monoclonal antibodies are responding very well and some released same day. The session is lengthy, but the beginning of each exec's comments includes some of the info above.
https://www.youtube.com/watch?v=acsvjnMOlr0
> the data is, however, of terrible quality
> worry less, live more.
I suggest one uncouple themselves from the Cathedral. Do not give them clicks, money or power.
"You do not speak for me, nor I for you."